Yes, every statistic has a sampling distribution (though some may be degenerate).
What would they be like?
The sampling distribution of a statistic - just as with the mean - will in general depend on the population distribution you start with (and the sample size, naturally).
As an example, in a random sample from a normal distribution, the sample variance is a multiple of a chi-squared random variable and so the sample s.d. is a multiple of a chi random variable.
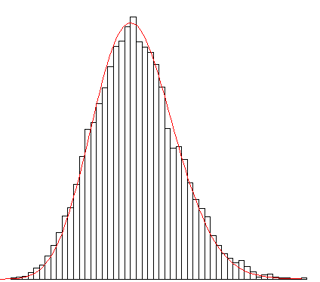
Below is a histogram of the sample standard deviations from 10000 samples of size 10 from a normal distribution, and the true sampling distribution (scaled-chi, red curve):

(click for larger version)
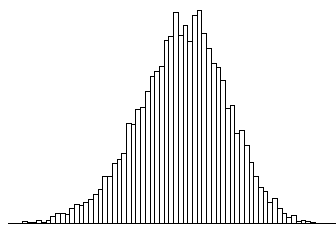
If you don't start with a normal population, the distribution of the sample s.d. is something else. E.g. here's the sample sd for 10000 samples of size 10 from a uniform distribution:

As we see, this one is mildly left skew rather than mildly right skew (I didn't calculate its theoretical distribution).
Note also that a sample proportion is a form of mean (label the in-category observations with a 1 and the out-of-category observations with a 0 and the sample mean is the sample proportion you started with). If the probability of being in group is constant and the observations are independent, it will have a discrete sampling distribution; a scaled binomial.
Many statistics are asymptotically normal under fairly mild conditions, but many are not (e.g. consider sample maxima for one).
Sampling distributions of various statistics come up in a number of situations. As an example, sampling distributions are important in hypothesis testing.


