5
$\begingroup$

I have a black box in which I know there is a 1D line and points along this line, and as output from this box I can get out a distance matrix for the points, but I know there is noise in the estimate for a given pair of points' distance. The diagonal of the output distance matrix is always zero and the upper half is simply *-1 of the lower half (i.e. sign of the distance is available). So, for example, here's some points and a custom noisy distance calculator that yields the kind of distance matrix I get as output:

set.seed(1)
x = c(1,3,4)
noisy_dist = function(x){
    out = matrix(0,nrow=length(x),ncol=length(x))
    for(i in 1:(length(x)-1)){
        for(j in (i+1):length(x)){
            out[i,j] = x[i] - x[j] + rnorm(1,0,.1)
            out[j,i] = -out[i,j]
        }
    }
    return(out)
}
D = noisy_dist(x)
print(D)
#          [,1]       [,2]       [,3]
# [1,] 0.000000 -2.0810097 -3.2430909
# [2,] 2.081010  0.0000000 -0.8850024
# [3,] 3.243091  0.8850024  0.0000000

So if I can only observe D, what would be appropriate approaches to using the observed information in this noisy distance matrix to estimate the latent location of the points?

$\endgroup$
4
  • 1
    $\begingroup$ How would this differ from a straightforward vanilla OLS model? Letting the coordinates of $p$ points be $\beta_i,$ $i=1,\ldots, p,$ the signed distances with noise are $$y_{ij} = \beta_i - \beta_j + \epsilon_{ij}=\mathbf{x}_{ij}\beta + \epsilon_{ij}$$ with iid Normal errors $\epsilon_{ij}$ and model matrix $x_{ij,k} = \delta_{ik}-\delta_{jk}.$ R's lm function should fit this beautifully (especially if you fix, say, $\beta_1=0$ to eliminate the inherent non-identifiability). Is your problem perhaps that $p$ is huge? Something else? $\endgroup$
    – whuber
    Commented Aug 25, 2020 at 15:14
  • $\begingroup$ Thanks for taking a look at this! If I understand correctly (and consequent to my latest edit of the question/code for clarity), $y_{ij}$ is the observed noisy-distance matrix D from my code. I'm having trouble discerning what I should be using as the model matrix $x_{ij,k}$ however; I don't follow what $\delta_{ik}$ and $\delta_{jk}$ are intended to be. Would you mind clarifying? $\endgroup$ Commented Aug 25, 2020 at 15:23
  • 1
    $\begingroup$ It's the Kronecker delta, a convenient notation for the model. You can create X in R in many ways, such as p <- nrow(D); X <- do.call(rbind, lapply((p-1):1, function(i) cbind(matrix(0, i, p-1-i), -1, diag(1,i,i)))). Then you're all set: lm.fit(X[, -1], D[lower.tri(D)]) does the work and the estimates will be its coefficients. For large $p$ you will want to use a sparse array representation of $X,$ because $X$ has $p^2(p-1)/2$ entries but only $p(p-1)$ of them are nonzero. $\endgroup$
    – whuber
    Commented Aug 25, 2020 at 16:10
  • $\begingroup$ Ah, beautiful, that works! Now to sit with the math and work at understanding why it works :P Thanks for your help! If you feel like posting your comment as an answer, I'll mark it as the solution. $\endgroup$ Commented Aug 25, 2020 at 16:28

1 Answer 1

4
$\begingroup$

Letting the coordinates of $p$ points be $\beta_i,$ $i=1,\ldots, p,$ the signed distances with noise are $$y_{ij} = \beta_i - \beta_j + \epsilon_{ij}=\mathbf{x}_{ij}\beta + \epsilon_{ij}$$ with iid Normal errors $\epsilon_{ij}$ and model matrix $x_{ij,k} = \delta_{ik}-\delta_{jk}.$

Not all $p$ coefficients are identifiable, however, because the distances don't determine the location. But if we arbitrarily fix one of the coefficients, say $\beta_1=0,$ we can estimate all the other locations relative to this one.

This is an Ordinary Least Squares (OLS) problem and so can be solved with the usual OLS machinery.


To illustrate, I generated four random points at locations

1.9 11.6  5.6  9.3

The model matrix $X = (x_{ij, k})$ (with its first column, for $\beta_1,$ omitted) is

        Point
Interval  2  3 4
     1-2  1  . .
     1-3  .  1 .
     1-4  .  . 1
     2-3 -1  1 .
     2-4 -1  . 1
     3-4  . -1 1

For instance, the first row in this matrix says the distance between points 1 and 2 equals $(1,0,0) (\beta_2,\beta_3,\beta_4)^\prime = \beta_2 = \beta_2-\beta_1$ (because, implicitly, $\beta_1=0$). The last row says the distance between points 3 and 4 is $-\beta_3 + \beta_4.$

The least squares estimates, compared to the locations, are good:

                2   3   4
True location 9.8 3.8 7.5
Estimate      9.8 3.1 7.8

(Notice that "true location" is relative to the first point at 1.9.)

As another illustration, I created 400 random points (at typical inter-point distances of $3$) and measured their $400(399)/2=159\,600$ distances with Gaussian noise of unit standard deviation (which is a fairly large fraction of these distances, making this a stringent test). Rather than print out the results, it's better to graph the $399$ coefficient estimates!
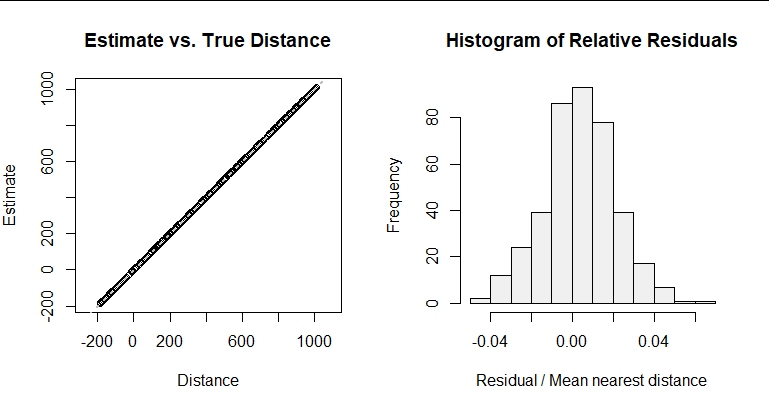
Figure

You can see it works very well. The reason is that we have $399$ measurements associated with each point, so the imprecision in each estimate should be about $1/\sqrt{399}\approx 0.05,$ or about $1.7\%$ of the average nearest-neighbor distance. The imprecision is about twice that because these measurements are not independent.

The software fit this model (of $159\,600$ observations and $399$ variables) in a couple of seconds. I used a sparse matrix for $X$ to save RAM.


This is the complete R code for generating the examples and figures. (Change n <- 4 to n <- 400 for the figures.) The estimates are stored in the vector b.


noisy_dist = function(x, sigma=1){
  out <- as.matrix(dist(x)) 
  eps <- matrix(0, nrow(out), ncol(out))
  i <- lower.tri(eps)
  eps[i] <- rnorm(sum(i), 0, sigma)
  (out + eps + t(eps)) * outer(x, x, function(i,j) sign(i-j)) # Signed distance
}
#
# Create a noisy distance matrix.
#
set.seed(17)
n <- 4
x <- runif(n, 0, 3*n)
names(x) <- seq_along(x)
if (length(x) <= 10) print(x, digits=2)

D = noisy_dist(x)
if (length(x) <= 10) print(D, digits=2)
#
# Create the model matrix associated with `D`.
#
library(Matrix)
X <- (function(ij) {
  f <- function(u) 
    sparseMatrix(i=seq_len(ncol(ij)), j=ij[u,], x=(-1)^u, dims=c(ncol(ij), max(ij))) 
  X <- f(1) + f(2)
  dimnames(X) <- list(Interval=paste(ij[1,], ij[2,], sep="-"), Point=seq_len(max(ij)))
  X
})(combn(seq_len(nrow(D)), 2))
if (length(x) <= 10) print(X[, -1])
#
# Estimate the coefficients.
#
library(MatrixModels)
b <- MatrixModels:::lm.fit.sparse(X[, -1], D[lower.tri(D)])
if (length(b) < 10) round(rbind(`True location`=x[-1] - x[1], Estimate=b), 1)
#
# Display some diagnostic plots.
#
par(mfrow=c(1,2))
plot(x[-1] - x[1], b, asp=1,
     xlab="Distance", ylab="Estimate",
     main="Estimate vs. True Distance")
abline(c(0,1), lty=3, lwd=2, col="Gray")

sigma <- diff(range(x)) / (length(x) - 1)
hist((b - (x[-1] - x[1])) / sigma,  col="#f0f0f0",
     main="Histogram of Relative Residuals",
     xlab="Residual / Mean nearest distance")
par(mfrow=c(1,1))
$\endgroup$
9
  • $\begingroup$ Could this work in the case of having missing distances due to missing points if the noisy points/distances are roughly on a grid? You could think of it as noisy data from OpenCV of aerial images of houses and empty lots on city blocks. Roughly 25% of the lots are empty (no coordinates). The aerial images are from various angles. I want the coordinates of the empty lots, plus coordinates of the homes that fit a gridline. Any suggestions would be appreciated. $\endgroup$
    – Jakub
    Commented Jul 5, 2022 at 7:10
  • $\begingroup$ @Jakub I believe it will work then, assuming there is no strong association between the missing distances and the errors. (For instance, if some demon started with a full dataset and systematically removed all distances related to point pairs approximately oriented north-south, conceivably the location estimates would be biased.) Nothing in the procedure needs to change: missing distances merely correspond to deleting some rows of the model matrix. But you can probably do even better by accounting explicitly for the varying angles, distances etc. of the images. $\endgroup$
    – whuber
    Commented Jul 5, 2022 at 13:30
  • $\begingroup$ Thanks. My demon is OpenCV, so I'm starting with noisy coordinates from contour and edge detection. There should be no reason why the errors would be serially correlated. Currently, I'm segmenting the points by what gridline they belong using k-NN. I then use a parallel slopes OLS model on the original coordinates combined with the same coordinates, but rotated 90°. It sounds like converting the data pts to distances would be much better than attempting to segment the data which occasionally fails. I stopped using R 5 yrs ago, so I'll have to convert it to Python, and that's why I asked first. $\endgroup$
    – Jakub
    Commented Jul 5, 2022 at 18:35
  • $\begingroup$ After re-reading the OP, I realized this is for points on a single line. My points are on a grid like homes on a street grid. I can't see anyway this would work for my purpose. $\endgroup$
    – Jakub
    Commented Jul 7, 2022 at 0:13
  • 1
    $\begingroup$ The point I was trying to make was that I would need a rotation matrix (which I thought was linear) to calculate the Manhattan distances on a rotated grid, but I do not know the angle. I can calculate Euclidean distances because they are rotation invariant. Am I wrong on that? I can see where my 30 seconds of jumble thoughts, while my mind was on something else, were confusing. Sorry for the confusion. My bad. $\endgroup$
    – Jakub
    Commented Jul 7, 2022 at 22:12

Your Answer

By clicking “Post Your Answer”, you agree to our terms of service and acknowledge you have read our privacy policy.

Not the answer you're looking for? Browse other questions tagged or ask your own question.