3
$\begingroup$

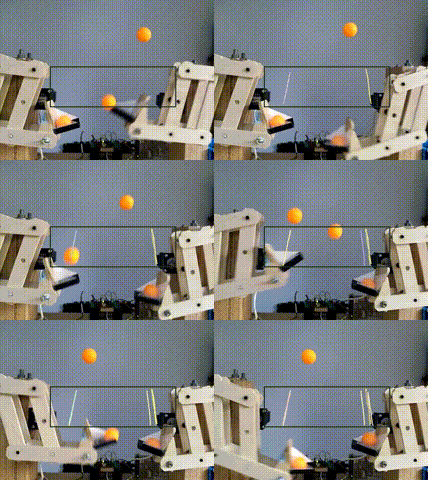
I have built a juggling machine. It has no sensors and moves in a consistent programed motion. In my attempts to make the machine juggle for as long as possible, I have been studying the accuracy of the throws. The machine doesn't actively catch the ball, but instead relies on the accuracy of the throw to direct the ball to where the hand will be.

A continuous run of about 3,000 throws (half-an-hour) was recorded on video. Computer vision was used to track the balls in a region of interest before the catch.

recording accuracy

I hypothesize that the accuracy of the throws is normally distributed. Eventually, the machine makes a bad throw and the ball is dropped (usually this is because the throw is long). I will attempt to improve upon my design, but before doing so I would like to measure the accuracy of this design for comparison.

I was able to generate this image. It is a composite image that shows all the throws (only for the region of interest):

composite image

To find the accuracy, I am trying to find the variance of the throw paths. How can I calculate the mean path? How can I calculate the distance of a particular path from the mean path?

$\endgroup$

1 Answer 1

2
$\begingroup$

Computing the mean and variance of the data is the easy part --- the difficult part here is extracting useable numerical data from your image. Since you have not specified to the contrary, I am going to assume that the image is your primitive in this problem; i.e., you have not derived this from some earlier output. Assuming this is the case, there are several ways to proceed, but they all involve some kind of computation of the light intensity at points on a "grid" within the picture. (Note that the "grid" here may be as small as the individual pixels in the image.)

One simple method would be to choose a horizontal line fairly low on your figure (but above the imperfection in the bottom right) and use the image to compute the light intensity at each vertical position along that horizontal line. If you are willing to assume that the light intensity is proportionate to the number of times the ball travelled within that path then the light intensity essentially gives you a "histogram" of the data along any given horisonal line. It should be possible to convert the image to a vector of numeric values giving the light intensity, and then you can use this to give you the underlying numerical data from which you can compute a mean position and the variance of that position. You would do this on both ends of the image along a chosen horizonal line, which would give you two mean locations and variances.

If you want to go further than this, you could consider the image across multiple horizontal lines (perhaps even over the whole arc) and this will give you location data at each height value. It should then be possible to fit a curve to the data to estimate the mean path and the variance from this path. This would be done using regression methods, and again, the biggest challenge is extraction of numerical data from the image.

$\endgroup$

Your Answer

By clicking “Post Your Answer”, you agree to our terms of service and acknowledge you have read our privacy policy.

Not the answer you're looking for? Browse other questions tagged or ask your own question.