1
$\begingroup$

I have electrophysiological data in the form of skin resistance in fish. I wish to explore if there is any variation in resistance based on the location on the body where the skin is taken from. In addition, I wish to explore how a change in salinity affects the resistance of the skin.

I have used the general linear model (GLM) function in SPSS to create a model, with the resistance values as my response and four categorical predictors. The model has four main effects and three interactions. N=144. The R-squared value and a lack-of-fit test both seem to indicate that the model is a good fit for my data, explaining ~80% of the observed variation. However, the residuals show large heteroscedasticity and non-normality.

However, if I rank my data and run the same analysis, my residuals are both normal and homoscedastic. I have seen that one can do a one-way ANOVA on ranks, in what is essentially a one-way Kruskal-Wallis. However, I don't know if the same approach is valid with a GLM, or if it is even valid to rank this type of data?

I would really appreciate any help or suggestions with this. I hope that I have provided enough information but if not, please let me know. This is my first question on here :)

Thanks!

$\endgroup$
8
  • 3
    $\begingroup$ The GLM doesn't know the data are ranks. It just sees, overall, an approximately uniform distribution. Trouble is that it's not just a matter of whether you have achieved well-behaved residuals. Your model predicts mean rank on that measure, and how interesting or useful is that scientifically? Tell us more about the distribution of skin resistance. My guess is that there is a transformed scale that allows a better analysis. I would recommend a generalized linear model as likely to be more satisfying. $\endgroup$
    – Nick Cox
    Commented Oct 24, 2020 at 17:57
  • $\begingroup$ Thanks so much for your reply! The data look to be normally distributed, but skewed somewhat to the right. I read that a square-root transformation is a good option when this is the case. So I applied same, reran the GLM, and now the residuals are normal with equal variances. $\endgroup$ Commented Oct 26, 2020 at 9:46
  • $\begingroup$ "normally distributed, but skewed somewhat to the right": the second contradicts the first.. Otherwise, sounds like progress, but a generalized linear model would still be better in giving you predictions on the original scale. I don't know if SPSS supports them. NB generalized linear model $\neq$ general linear model. $\endgroup$
    – Nick Cox
    Commented Oct 26, 2020 at 9:53
  • $\begingroup$ Would it be an option to back-transform the regression coefficients to allow for interpretation? SPSS does allow one to run a generalized linear model, but it doesn't seem to provide the same level of information as the general linear model i.e. I can seem to see any measures of effect size or pseudo R-squared etc. $\endgroup$ Commented Oct 27, 2020 at 12:40
  • $\begingroup$ No, the coefficients can't be back-transformed helpfully if you used a square root transformation. The dataset is perhaps not too big to be posted? $\endgroup$
    – Nick Cox
    Commented Oct 27, 2020 at 12:44

1 Answer 1

1
$\begingroup$

The data allow various suggestions:

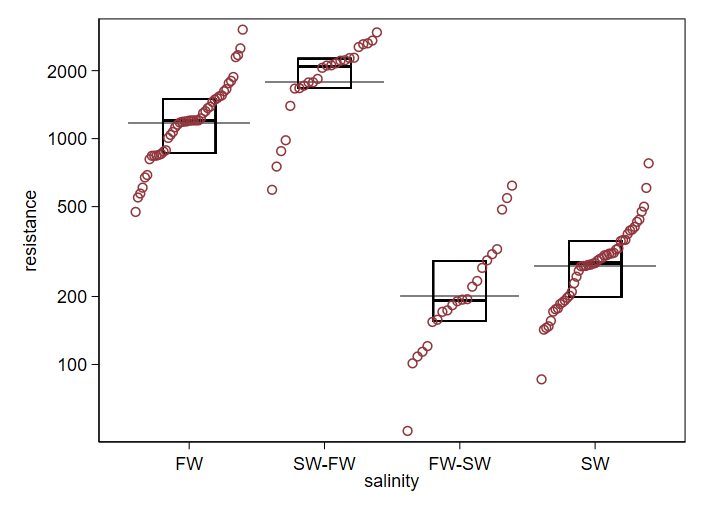
  1. Resistance should be looked at on logarithmic scale. It is perhaps slightly too strong a transformation, but square root is too weak and there isn't enough inherent advantage in a model using a square root scale to prefer the latter.

  2. Salinity appears the only big deal among the possible predictors. If FW and SW (fresh water and salt water, presumably) are the extremes the ordering of the response distributions seems at odds with that, which may be a matter of sample quirks or of other predictors I am ignoring.

  3. A generalized linear model with log link is recommended. The family of distribution assumed doesn't seem to matter: I suspect that there is a deeper structural reason for it being irrelevant (identical results rather than slightly different).

This plot shows the main story in those suggestions. The boxes show median and quartiles as usual; the other horizontal lines are geometric means.

enter image description here

I don't use SPSS.

$\endgroup$
1
  • 1
    $\begingroup$ Thank you so much for taking the time to help with this! I really appreciate it :) $\endgroup$ Commented Oct 27, 2020 at 18:16

Your Answer

By clicking “Post Your Answer”, you agree to our terms of service and acknowledge you have read our privacy policy.

Not the answer you're looking for? Browse other questions tagged or ask your own question.