3
$\begingroup$

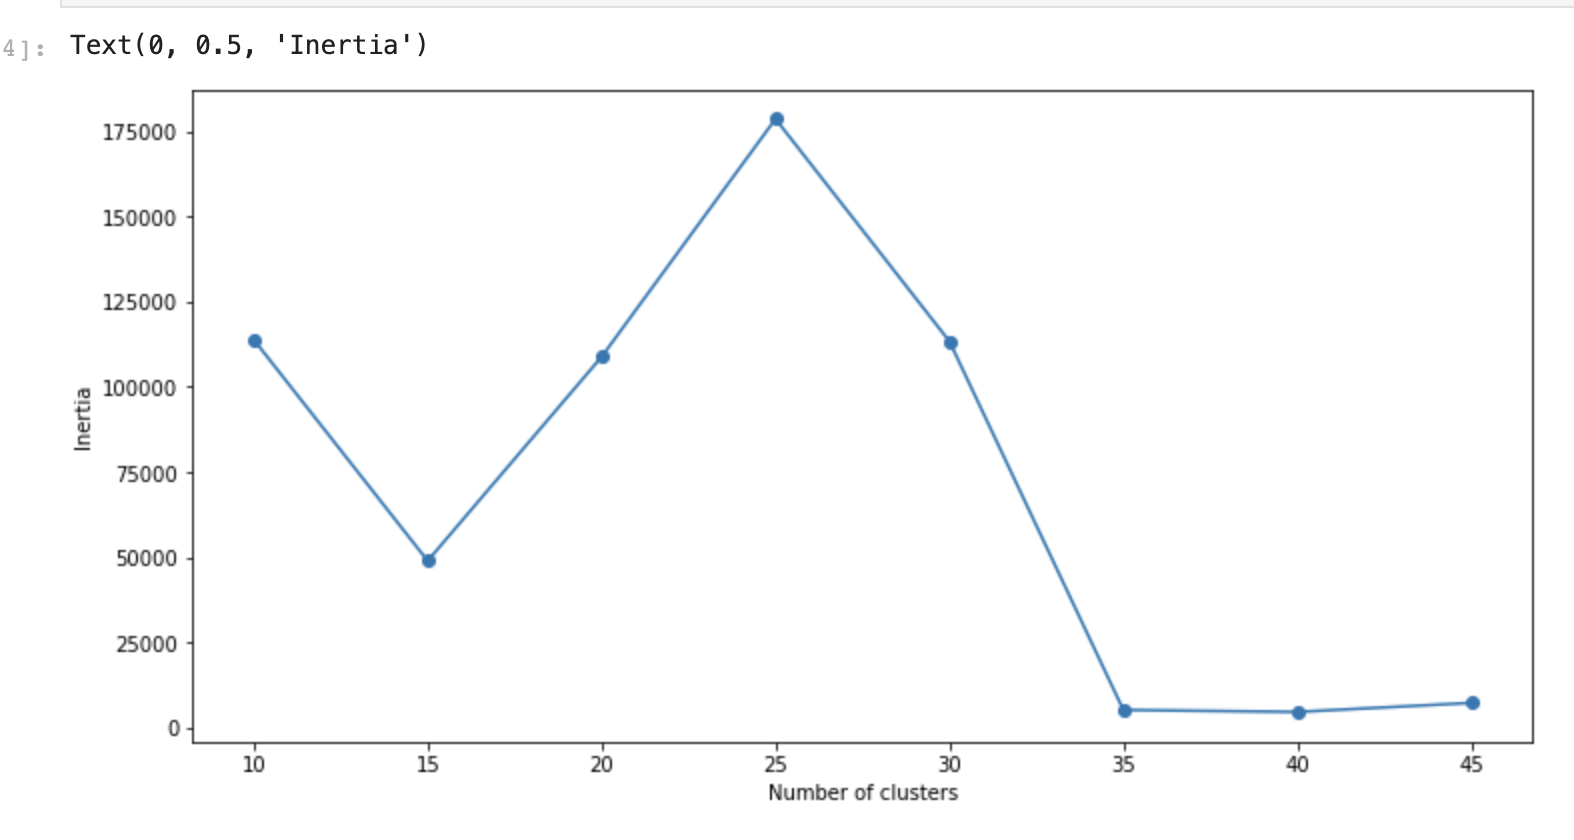
I am doing kmeans clusters on sales data and i see that inertia increases for the initial increase in the number of clusters. Can you please explain why that happens? I am doing Batched Kmeans for the scale of the data. Below are the graphs for sales amount and frequency of orders.curve for monetary values of sales (1 feature only)
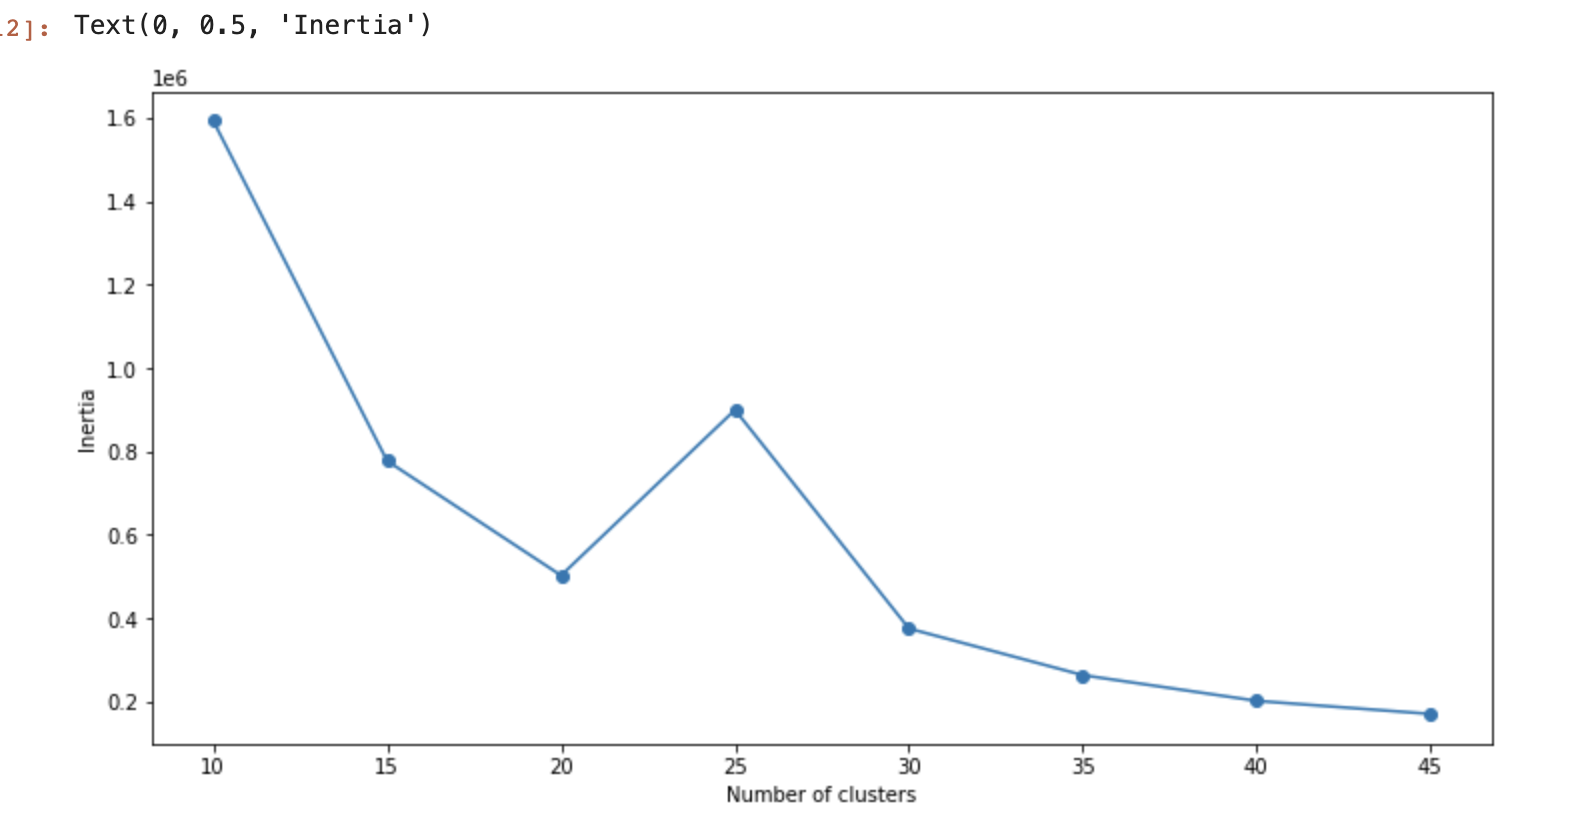
frequency of orders

#code
SSE = []
for cluster in range(10,50,5):
    kmeans = MiniBatchKMeans(n_clusters = cluster, init='k-means++',random_state=0, batch_size=12)
    kmeans.fit(m_scaled)
    SSE.append(kmeans.inertia_)

# converting the results into a dataframe and plotting them
frame = pd.DataFrame({'Cluster':range(10,50,5), 'SSE':SSE})
plt.figure(figsize=(12,6))
plt.plot(frame['Cluster'], frame['SSE'], marker='o')
plt.xlabel('Number of clusters')
plt.ylabel('Inertia')```
$\endgroup$

1 Answer 1

2
$\begingroup$

As number of clusters increase the inertia is expected to decrease but is not guaranteed because k-means algorithm needs random initialisation and there are probably local minima. So, the local optimum for 20-25-30 clusters might give you larger inertia. The typical thing to do is doing k-means several times with random seed and pick the best one.

$\endgroup$
1
  • $\begingroup$ This comment is to ask for clarification of understanding. Inertia is calculated as the sum of squared distance for each point to its closest centroid, i.e., its assigned cluster. We want inertia to decrease roughly monotonically with increasing $k$. The reason for the humps is that for intermediate values of $k$ the combinatorial large number of potential centroids and associated clusters means the initial randomly selected centroids can cause local minima to occur relatively frequently? $\endgroup$ Commented Oct 28, 2020 at 21:59

Your Answer

By clicking “Post Your Answer”, you agree to our terms of service and acknowledge you have read our privacy policy.

Not the answer you're looking for? Browse other questions tagged or ask your own question.