5
$\begingroup$

I am trying to run a beta regression using the betareg package and I am using the following script:

require(betareg)


betareg(response ~ predictor
                    ,na.action = na.omit
                    ,weights = sqrt(total)
                    , data = ex.dat.new) 

And R returns this error:

Error in betareg(response ~ predictor, na.action = na.omit, weights = sqrt(total),  : 
  invalid dependent variable, all observations must be in (0, 1)

However, the dependent variable (named "response" here) IS constrained between 0 and 1.

Why is R returning this error and how can I correct it?

Data:

    dput(ex.dat.new)
    structure(list(predictor = structure(c(2L, 2L, 2L, 2L, 2L, 2L, 
    3L, 3L, 3L, 3L, 3L, 3L, 4L, 4L, 4L, 4L, 4L, 4L, 5L, 5L, 5L, 5L, 
    5L, 5L, 6L, 6L, 6L, 6L, 6L, 6L, 7L, 7L, 7L, 7L, 7L, 7L, 8L, 8L, 
    8L, 8L, 8L, 8L, 9L, 9L, 9L, 9L, 9L, 9L, 10L, 10L, 10L, 10L, 10L, 
   10L, 1L, 1L, 1L, 1L, 1L, 1L, 11L, 11L, 11L, 11L, 11L, 11L, 12L, 
   12L, 12L, 12L, 12L, 12L), .Label = c("Asoca", "bida", "coma", 
   "cyro", "melo", "oeno", "pano", "sena", "sida", "soam", "soda", 
   "verb"), class = "factor"), response = c(1, 1, 0.981270985, 1, 
   0.911258698, 1, 0.249252611, 0.671639842, 0.575247687, 0.943358751, 
   0.470602887, 0.875696109, 1, 1, 1, 1, 1, 1, 1, 0.131273134, 0.479774791, 
   0.497419936, 0.54108693, 0.838144234, 1, 1, 1, 1, 0.868294819, 
   1, 1, 1, 1, 1, 1, 1, 0.305218209, 1, 1, 1, 1, 0.095933078, 1, 
   1, 1, 1, 1, 1, 0.217037264, 0.410118055, 0.173707357, 0.200733967, 
   0.469833694, 0.208464348, 0.407013896, 0.846212651, 0.299872736, 
   0.965380984, 0.251676335, 0.806683955, 1, 1, 1, 1, 1, 1, 0.934555905, 
   0.564142452, 1, NA, 1, 0.029682211), total = c(109.98, 46.834, 
   293.662, 197.144, 59.927, 7.33, 70.579, 222.125, 201.767, 43.802, 
   417.541, 143.117, 70.658, 167.073, 666.542, 49.872, 258.847, 
   93.83, 56.036, 116.17, 378.5276, 12.209, 163.58, 182.329, 209.913, 
   411.1590278, 1003.223, 29.3499744, 95.896, 160.8383437, 124.437, 
   52.017, 187.045, 132.032, 67.188, 86.12, 171.189, 21.27, 29.69, 
   106.1, 77.14, 56.185, 68.97225736, 17.475, 539.401, 5.9, 49.256, 
   12.854, 342.015, 250.562, 2177.605021, 748.1001011, 1035.573167, 
   275.414, 660.717, 323.102, 1273.727, 285.97, 212.368, 140.366, 
   420.044, 54.295, 802.118, 150.612, 157.469, 85.275, 368.131, 
   35.998, 349.624, 0, 13.207, 191.731)), class = "data.frame", row.names = c(NA, 
  -72L))
$\endgroup$
1
  • 5
    $\begingroup$ At a glance I see two problems: one is an NA in the responses; but more important are the many exact values of $1.$ If we interpret the (0, 1) of the error message to mean the open interval $(0,1)=\{x\mid0\lt x\lt1\},$ that would explain the problem. These data don't look suitable for beta regression. (All beta densities are either zero or not well defined at the values $0$ and $1.$) Correcting the error, then, requires choosing a suitable model. We can't help you with that unless you provide information about what your data mean and what you're trying to accomplish with this regression. $\endgroup$
    – whuber
    Commented Nov 11, 2020 at 23:18

2 Answers 2

11
$\begingroup$

The error message posted by R tells you what the problem is:

invalid dependent variable, all observations must be in (0,1)

In other words, your dependent variable should take values that are strictly greater than 0 and strictly less than 1; they cannot be equal to 0 or equal to 1.

In your case, you have several response values that are equal to 1, so R throws the invalid response variable message.

Beta regression would work for response values in (0,1); because you have response values in (0,1] (with a fair number of these values equal to 1), you will need to consider one-inflated beta regression. If your response had values in [0,1) (with a fair number of these values equal to 0), you could consider a zero-inflated beta regression if that made sense for your data - based on Dr. Zeileis response to your question, you might not be able to consider this type of model for your data. See the 2012 article A general class of zero-or-one inflated beta regression models by Ospina and Ferrari for further details on these types of models.

You can fit a one inflated regression model in R using the gamlss and gamlss.dist packages, for example. The latter includes a BEOI() function which defines the one-inflated beta distribution, a three parameter distribution, for a gamlss.family object to be used in GAMLSS fitting using the function gamlss(). (It also includes a BEZI() function for a zero-inflated beta distribution.). Your most complete regression model would be specified like this:

library(gamlss)

library(gamlss.dist)

model <- gamlss(response ~ 1 + predictor, 
                sigma.formula = ~ 1 + predictor, 
                nu.formula = ~ 1 + predictor, 
                family=BEOI, 
                data=yourdata)

See http://www.gamlss.com/wp-content/uploads/2018/01/InflatedDistributioninR.pdf.

$\endgroup$
2
  • 1
    $\begingroup$ Thanks very much Isabella, this is very helpful. $\endgroup$
    – JKO
    Commented Nov 12, 2020 at 20:37
  • $\begingroup$ You're most welcome, @JKO. If the thread you pointed to in your other comment suggested transforming the response variable as per *eac2222's "Better Lemon Squeezer" response, please try not to do that - transformation of so many 1 values can induce substantial bias in your subsequent modelling. $\endgroup$ Commented Nov 13, 2020 at 0:05
4
$\begingroup$

As the error message tells you betareg() requires responses to be greater than $0$ and less than $1$, i.e., the open interval $(0, 1)$. That is the support of the beta distribution which is modeled by beta regression. Your data has a very high share of $1$ observations (40 out of 71, excluding the NA) and consequently does not seem to be suitable for beta regression.

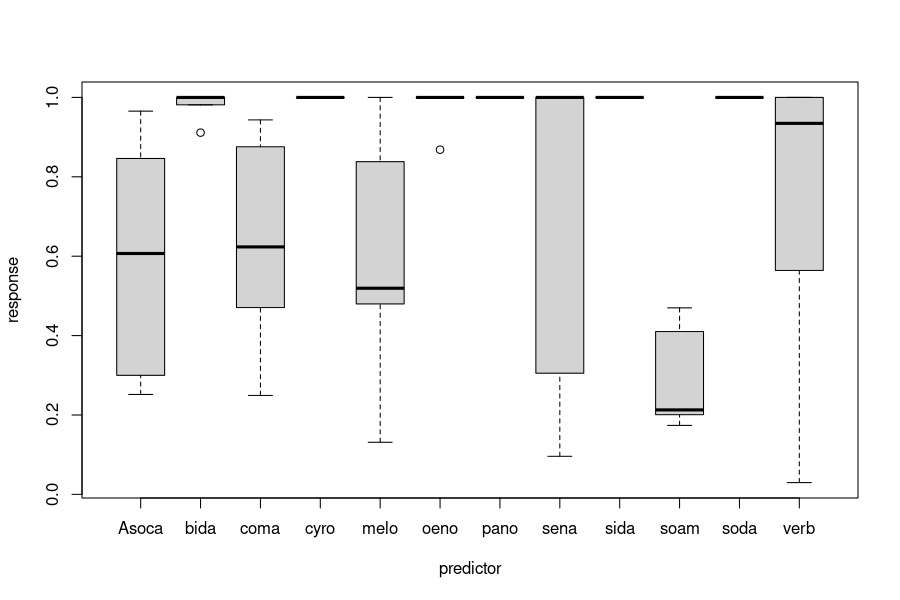
Some authors suggest to use a 1-inflated beta regression in such scenarios but I doubt that this is the right model in your case. If you look at the data:

plot(response ~ predictor, data = ex.dat.new)

boxplot

Then you see that many groups have no variation at all in the response (cyro, pano, sida, soda) and others have very little variation in the response (bida, oeno). First, modeling something as stochastic that has no variation at all is challenging without further assumptions. Second, you need to consider carefully what exactly you want to model. The details will depend on your specific setup and what these data mean etc.

$\endgroup$
5
  • 1
    $\begingroup$ (+1) Very nice response! I revised my own response to reflect your concerns about the lack of variability in the response values for some of the predictor categories. $\endgroup$ Commented Nov 12, 2020 at 1:35
  • 2
    $\begingroup$ This post stats.stackexchange.com/questions/48028/… was very helpful. $\endgroup$
    – JKO
    Commented Nov 12, 2020 at 17:52
  • $\begingroup$ @JKO: Can you point us to the specific answer that you found helpful from the thread you linked to in your comment? That thread has multiple answers so it's impossible to tell which of them you thought was applicable to your situation. Naming the author of the answer would help us determine what is going on. $\endgroup$ Commented Nov 13, 2020 at 0:00
  • 1
    $\begingroup$ We don't know much about the meaning of your categories for the predictor variable, but one option in practice could be to merge the categories where you have little variation either with each other or would other categories that would be conceptually related. $\endgroup$ Commented Nov 13, 2020 at 0:01
  • 1
    $\begingroup$ The answer provided by eac222. However, based on the above discussion, I am leaning to using a different model structure (a one-inflated beta regression using gamlss() ) $\endgroup$
    – JKO
    Commented Nov 13, 2020 at 15:44

Your Answer

By clicking “Post Your Answer”, you agree to our terms of service and acknowledge you have read our privacy policy.

Not the answer you're looking for? Browse other questions tagged or ask your own question.