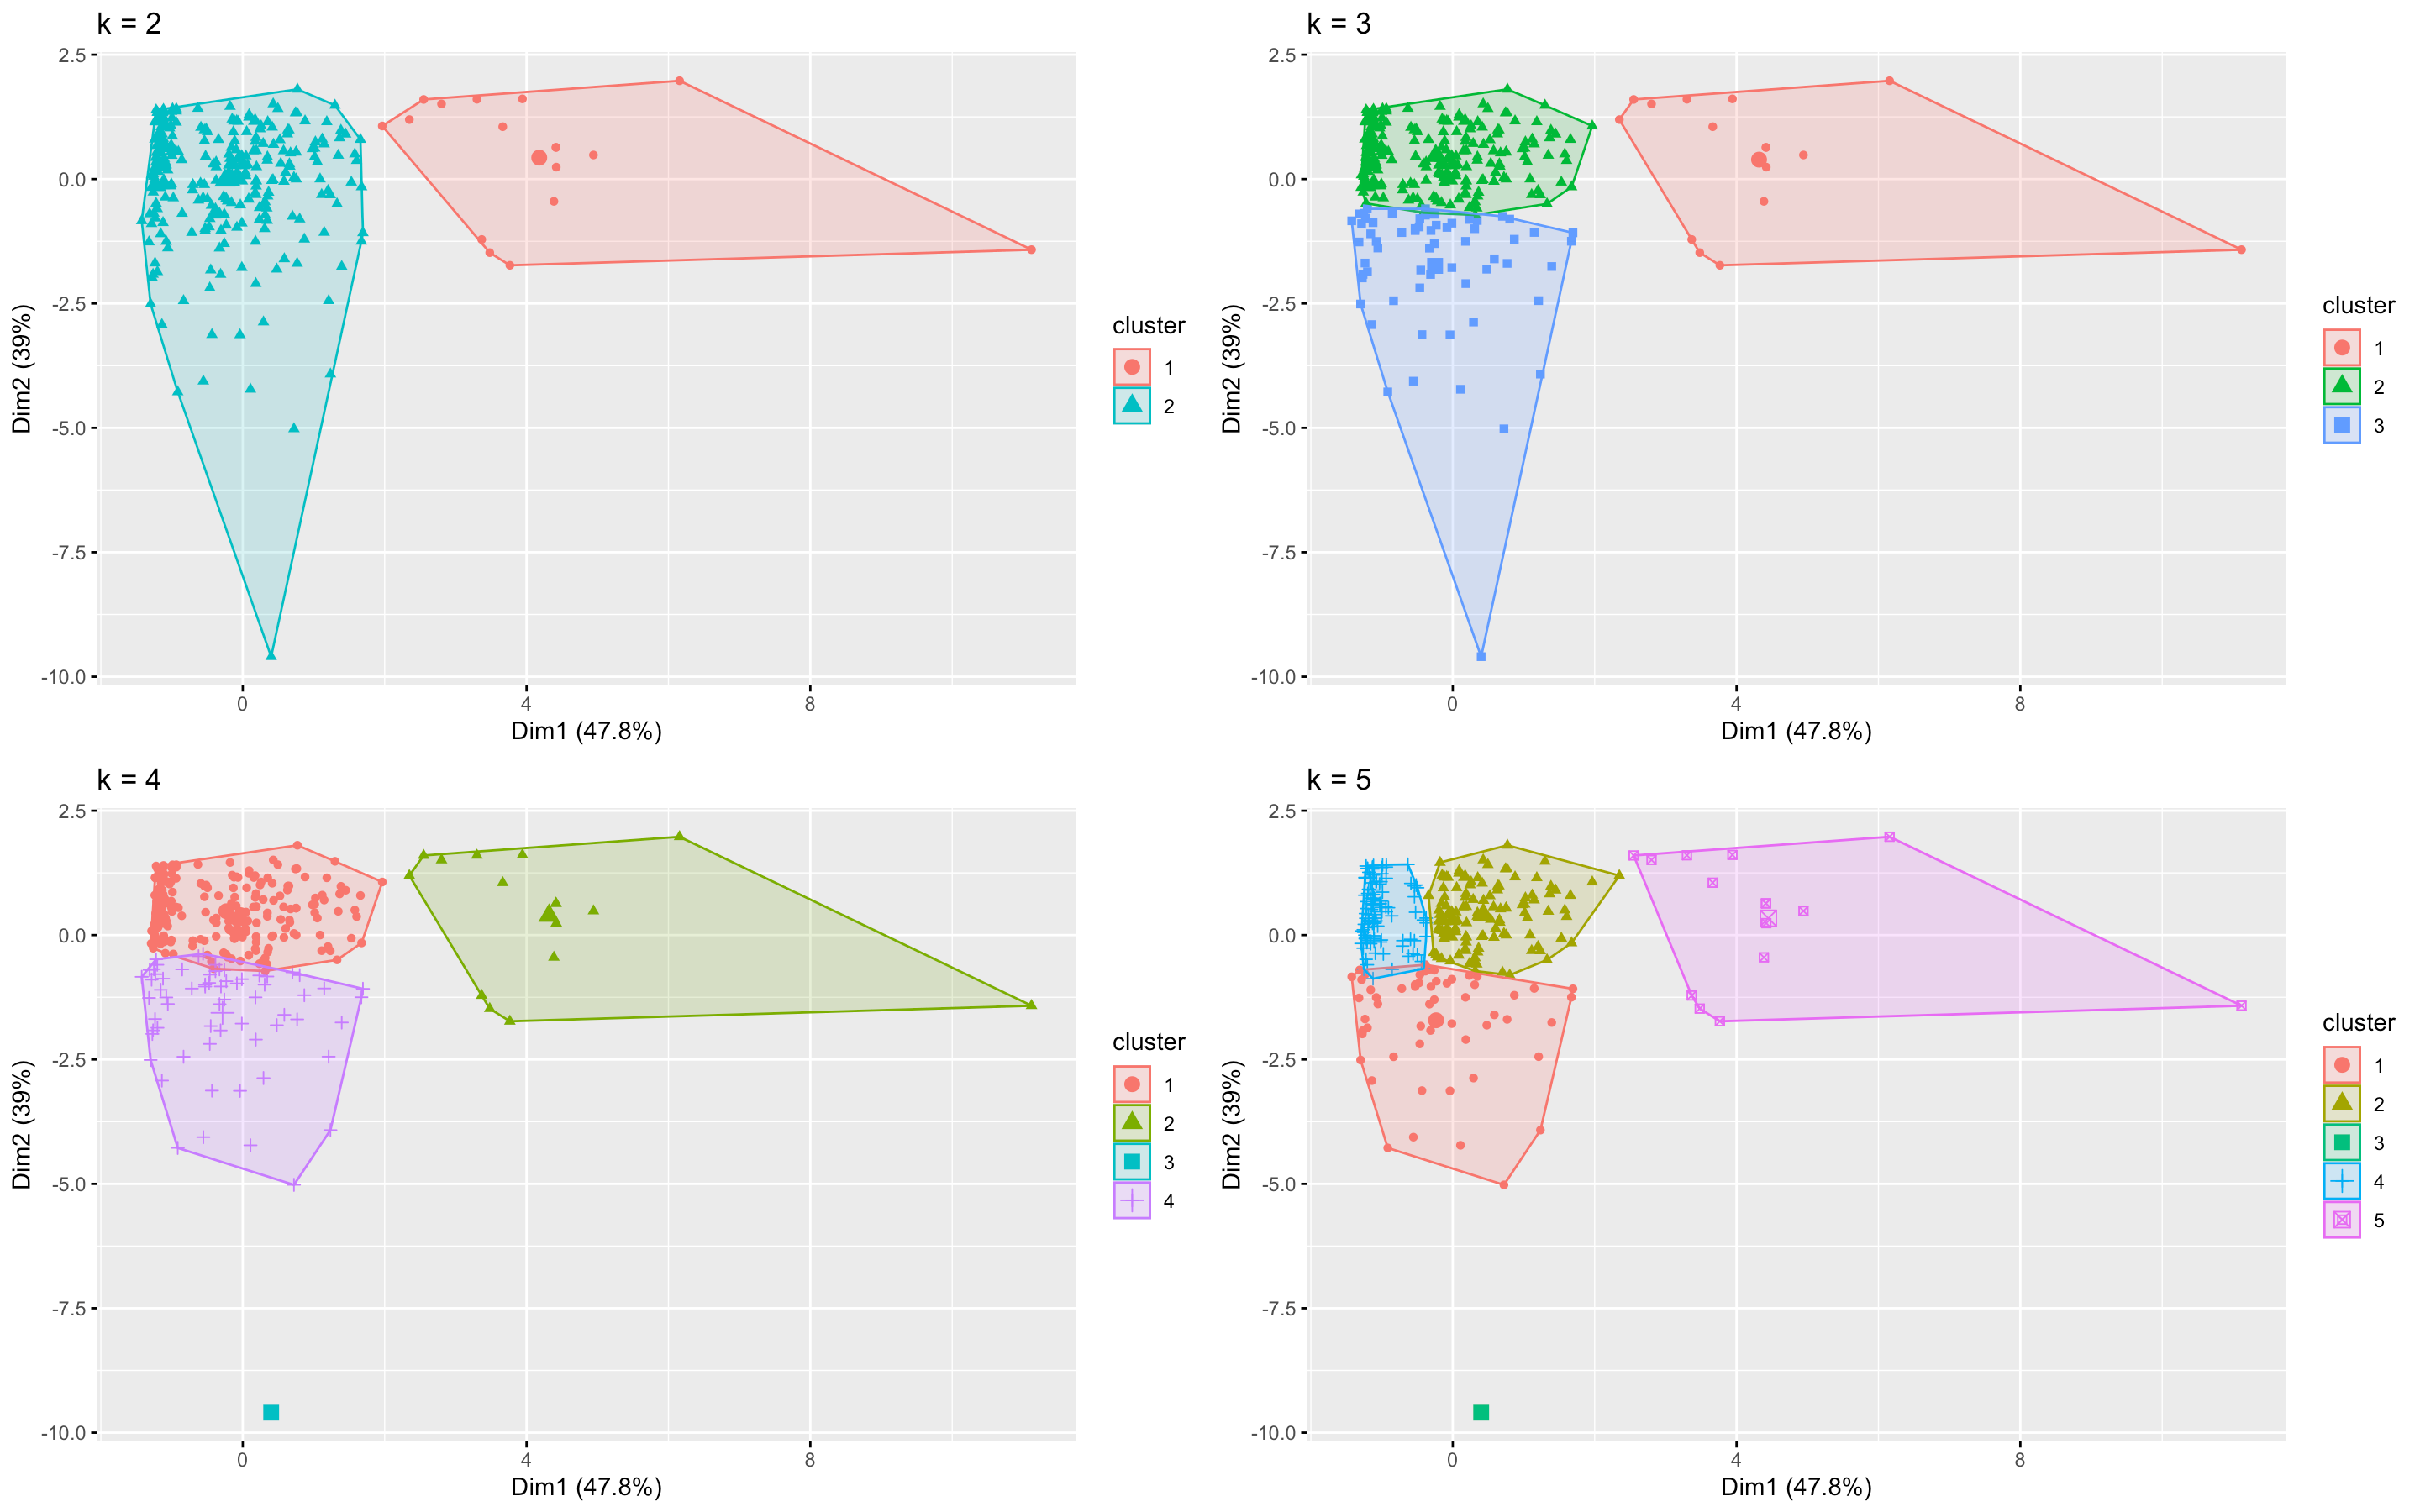
The methodologies in calculating optimal are different.
The silhouette coefficient measures how similar an observation x[i] is to the
the other objects in its own cluster versus those in the neighbouring cluster.
The gap statistic compares the total within intra-cluster variation for different values
of k with their expected values under null reference (random uniform) distribution of the data. The optimal cluster number will be one that maximises the gap statistic.
You should also make an elbow plot of the different k's vs total within ss for a visual inspection. But the disadvantage of elbow and average silhouette methods is that, they measure global clustering characteristic only. The gap statistic provides a more formalized statistical procedure.
You can also try a "majority rule" option of several different cluster validation statistics. I would recommend having a look at the nb object and reading up on the cluster validation tests performed. Also domain knowledge is always very important in unsupervised learning!
nb <- NbClust::NbClust(data = scale(data), min.nc = 2, max.nc = 5, distance = "euclidean", method = "kmeans")
nb$Best.nc
factoextra::fviz_nbclust(nb)

