3
$\begingroup$

Say I have the following sample:

-0.38848247;0.21655804;-1.08211969;0.00369104;0.0993393;0.25531731;1.40574444;-1.80271115;-0.58780605;-0.35026458;0.67197532;-1.29654652;-0.58874467;-0.4004176;1.46242829;0.83946654;-0.24861179;-1.604154;1.53555232;1.45589014;-0.52092604;1.65504054;0.12854317;1.66771236;1.47964458;-1.55677722;-0.40070632;-0.41957953;0.37803884;0.45349904;1.18265468;1.43979945;-1.55395031;0.01054229;0.48887945;0.12949194;-0.40283111;1.2998402;-1.02205575;-0.34370088;0.22117962;0.52840463;-0.9584811;1.22482249;-1.51189671;0.372597;1.68446854;-0.74440632;1.33920212;0.18072373;-0.35813474;0.39400846;1.18971633;1.02192759;-1.90422461;0.18459334;0.18096905;-1.73870267;1.57349896;-1.05632536;0.1864611;-1.49696658;0.51070568;-2.25007651;-0.64768552;1.80404194;2.25164576;-0.07925576;-0.83550267;-1.65513631;0.25913869;0.36030077;-0.09006407;-1.64359237;-0.1312756;-0.13790883;-0.09940115;-0.02089164;-0.60924589;-0.05451811;2.11736111;-1.40329353;-0.71788744;-0.45888623;-0.75608368;0.45762458;-0.24299548;-0.29224218;-1.0488731;-0.62028903;-0.08257067;0.92297771;0.2964071;-0.02598973;-0.20439059;-0.25195469;0.20572878;-0.49343988;0.25886695;1.20595313

How can I simulate random variables that would have the same density function as that of the above sample? (i.e same law)

A quick and dirty solution is to perform a uniform random selection out of this sample, but I am interested in more sophisticated methods. Any ides? literature references?

$\endgroup$
2
  • $\begingroup$ Is there something you don't like about the solution you proposed? $\endgroup$ Commented Mar 1, 2013 at 12:35
  • $\begingroup$ True. Does my code below help? It should obviate issues of small samples. $\endgroup$ Commented Mar 1, 2013 at 13:53

3 Answers 3

1
$\begingroup$

I like the idea you proposed. But if you do want alternatives what about fitting a function and then using rejection sampling based on it? Not that it'd be way different but still.

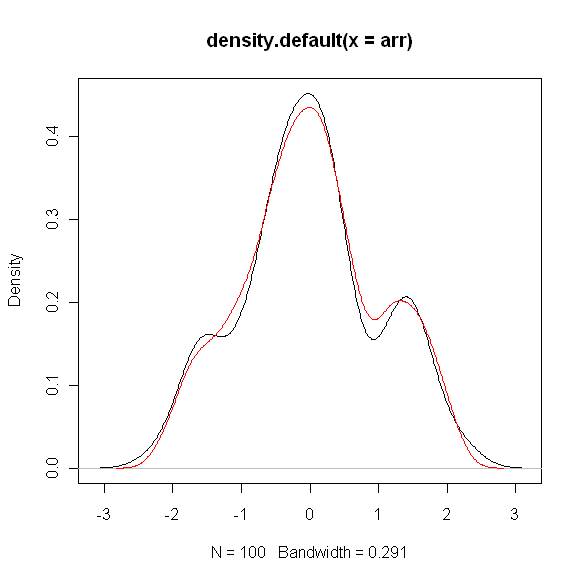
I'm no expert, but how about something like this? Assume the array arr contains your dataset and op the simulated samples.

Red line is the simulated data. in the image below

result<-density(arr,n=256)
nsamp<-3000

data<-c()

data$x<-runif(nsamp,min(arr),max(arr))
	data$y<-runif(nsamp,0,max(result$y))

op<-c()

for(i in seq(1,nsamp))
{
    x<-data$x[i]
	    y<-result$y[which.min(abs(x-result$x))]
	    if( data$y[i]<y)
        {op<-rbind(op,c(x))}
}

    hist(op,20)
$\endgroup$
2
  • $\begingroup$ Code added above. See if it helps. $\endgroup$ Commented Mar 1, 2013 at 14:46
  • $\begingroup$ (1) What range would you rather use for x otherwise? I assumed the range of your data as an estimate (2) I don't decide. You could keep looping till you collect enough samples. How many samples do you need? (3) Using density is the way I thought of. Bet there are other ways. Can you elaborate your concerns about using density? $\endgroup$ Commented Mar 1, 2013 at 15:02
1
$\begingroup$

I would discourage you from using density estimation in such a small data set. In non-parametric density estimation, the bias is on the same order as the variance, which generally is OK if and only if you have sufficient data that the variance is low. In this case both bias and variance will be high--very slight perturbations of your sample will yield wildly fluctuating estimates of your density, which on average are sufficiently incorrect as to be unuseful.

Instead, you should use a wild bootstrap--that is, instead of using a multinomial weight (sampling with replacement), use a continuous weight, e.g. exp(1). Kosorok's free textbook contains useful information in the bootstrap chapter. This adjustment means that every data point will show up in each bootstrap resample. Each bootstrap resample will also have the same density as the original sample, as you requested.

$\endgroup$
1
  • $\begingroup$ Thanks for your response. That would help better understand if you have a piece of code. $\endgroup$
    – dfhgfh
    Commented Apr 10, 2013 at 13:14
1
$\begingroup$

A first approach (which can be justified asymptotically) could be fitting a nonparametric density estimator (KDE, for example) to your data and then sampling from it. I think it is impossible to sample exactly from the same density, unless it is known.

#Your data
x=c(-0.38848247,0.21655804,-1.08211969,0.00369104,0.0993393,0.25531731,
1.40574444,-1.80271115,-0.58780605,-0.35026458,0.67197532,-1.29654652,
-0.58874467,-0.4004176,1.46242829,0.83946654,-0.24861179,-1.604154,
1.53555232,1.45589014,-0.52092604,1.65504054,0.12854317,1.66771236,
1.47964458,-1.55677722,-0.40070632,-0.41957953,0.37803884,0.45349904,
1.18265468,1.43979945,-1.55395031,0.01054229,0.48887945,0.12949194,
-0.40283111,1.2998402,-1.02205575,-0.34370088,0.22117962,0.52840463,
-0.9584811,1.22482249,-1.51189671,0.372597,1.68446854,-0.74440632,
1.33920212,0.18072373,-0.35813474,0.39400846,1.18971633,1.02192759,
-1.90422461,0.18459334,0.18096905,-1.73870267,1.57349896,-1.05632536,
0.1864611,-1.49696658,0.51070568,-2.25007651,-0.64768552,1.80404194,
2.25164576,-0.07925576,-0.83550267,-1.65513631,0.25913869,0.36030077,
-0.09006407,-1.64359237,-0.1312756,-0.13790883,-0.09940115,-0.02089164,
-0.60924589,-0.05451811,2.11736111,-1.40329353,-0.71788744,-0.45888623,
-0.75608368,0.45762458,-0.24299548,-0.29224218,-1.0488731,-0.62028903,
-0.08257067,0.92297771,0.2964071,-0.02598973,-0.20439059,-0.25195469,
0.20572878,-0.49343988,0.25886695,1.20595313)

# sample size
length(x)

# KDE
plot(density(x))

# Sampling from a KDE
samplekde = function(n,data){
resp = vector()
samp = sample(1:length(data),n,rep=T)
h = density(data)$bw
for(i in 1:n) resp[i] = rnorm(1,data[i],h)
return(resp)
}

# Example
x1 = samplekde(100,x)

plot(density(x1))
points(density(x),col="red",type="l")

# qqplot to check how similar x and x1 are
qqplot(x,x1)

Page 5 of this file

http://www.stat.cmu.edu/~cshalizi/350/lectures/28/lecture-28.pdf

The bandwidth parameter used in my code is the one used by default in the R command density().

$\endgroup$
1
  • $\begingroup$ @David Khireche The code simply samples from a KDE in the usual way, then the consistency. $h$ is the bandwidth involved in this estimation/simulation, it does not represent a perturbation at all. You might want to read a bit on KDE if you are interested on this approach. $\endgroup$
    – user21438
    Commented Mar 1, 2013 at 14:50

Your Answer

By clicking “Post Your Answer”, you agree to our terms of service and acknowledge you have read our privacy policy.

Not the answer you're looking for? Browse other questions tagged or ask your own question.