The gap statistic is a great way of doing this; Tibshirani, Hastie & Walther (2001).
http://stat.ethz.ch/R-manual/R-devel/library/cluster/html/clusGap.html - The relevant R package.
The idea is that it performs a sequential hypothesis test of clustering your data for K=1,2,3,... vs a null hypothesis of random noise, which is equivalent to one cluster. Its particular strength is that it gives you a reliable indication of whether K=1, i.e. whether there are no clusters.
Here's an example, I was inspecting some astronomy data a few days ago as it happens - namely from a transiting exoplanet survey. I wanted to know what evidence there are for (convex) clusters. My data is 'transit'
library(cluster)
cgap <- clusGap(transit, FUN=kmeans, K.max=kmax, B=100)
for(k in 1:(kmax-1)) {
    if(cgap$Tab[k,3]>cgap$Tab[(k+1),3]-cgap$Tab[(k+1),4]) {print(k)};
    break;
}
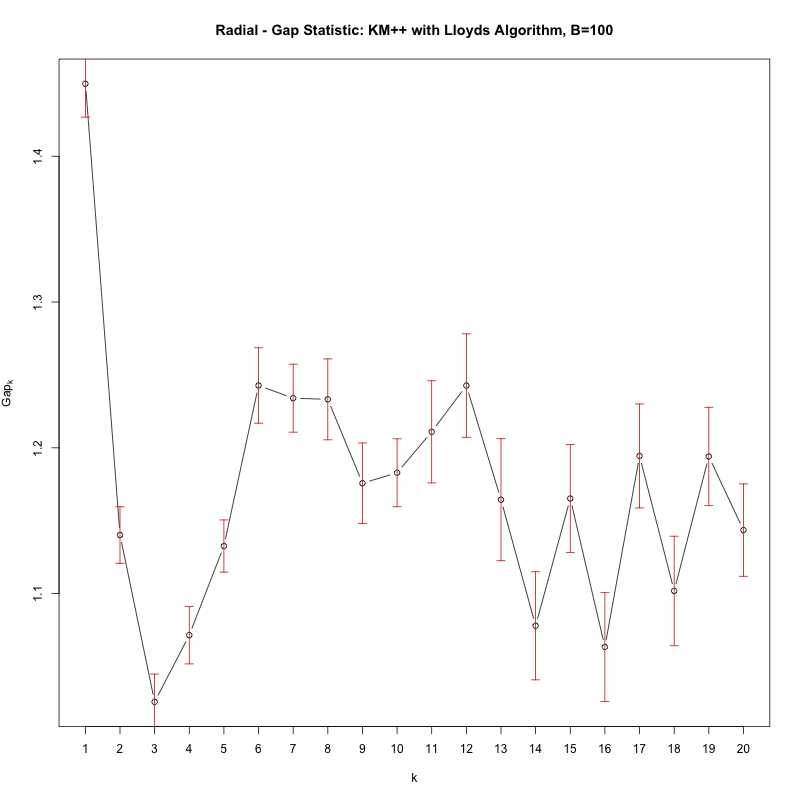
With the gap statistic you're looking for the first value of K where the test 'fails' i.e. the gap statistic significantly dips. The loop above will print such a k, however simply plotting cgap gives you the following figure:
 See how there's a significant dip in the Gap from k=1 to k=2, that signifies there are in fact no clusters (i.e. 1 cluster).

 See how there's a significant dip in the Gap from k=1 to k=2, that signifies there are in fact no clusters (i.e. 1 cluster).