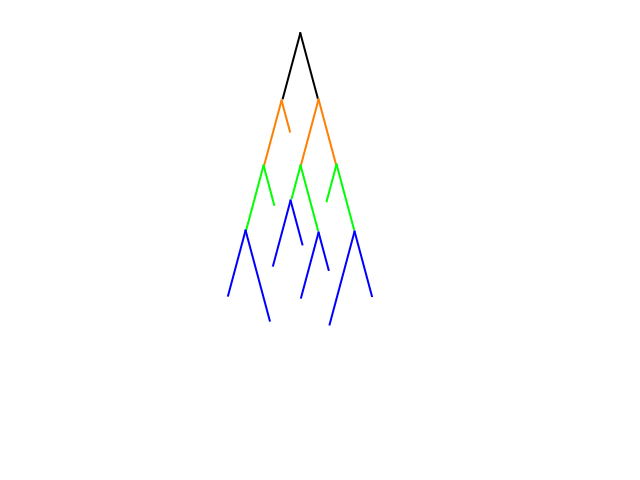
I have some data from neuroscience, to be more precise a set of data which represents the connections between brain cells (so called "axons"). These connections form a binary tree as depicted below. Interestingly when I look at the lengths of these edges (i.e. axons) at each depth, the lengths are lognormally distributed. I.e. the black edges length has a lognormal distribution, the orange edges length has a lognormal distribution and so on.
More then that, even if I look at the distribution of the lengths of all edges from all depths, still I do observe a lognormal distribution. I dont add the edges up but just again consider each edges length as the Random Variables Value and plot its distribution.
So my question is: How can it be explained analytically, that from lognormals at each depth also a lognormal over all depths arise?

