1
$\begingroup$

I was told, that the Cox with a single categorical covariate is equal to the Kaplan-Meier stratified by the levels of this covariate. But the two graphs below don't support it. I also use strata() in Cox model and got a very similar curve to Kaplan-Meier, however slightly differing.

So, assuming I draw Kaplan-Meier for 2 curves, how can I take HR from Cox for them, if the shapes are so different? Is there, indeed, a need for stratification rather than including the covariate?

This is done in R, but I believe the problem is in the statistical explanation.

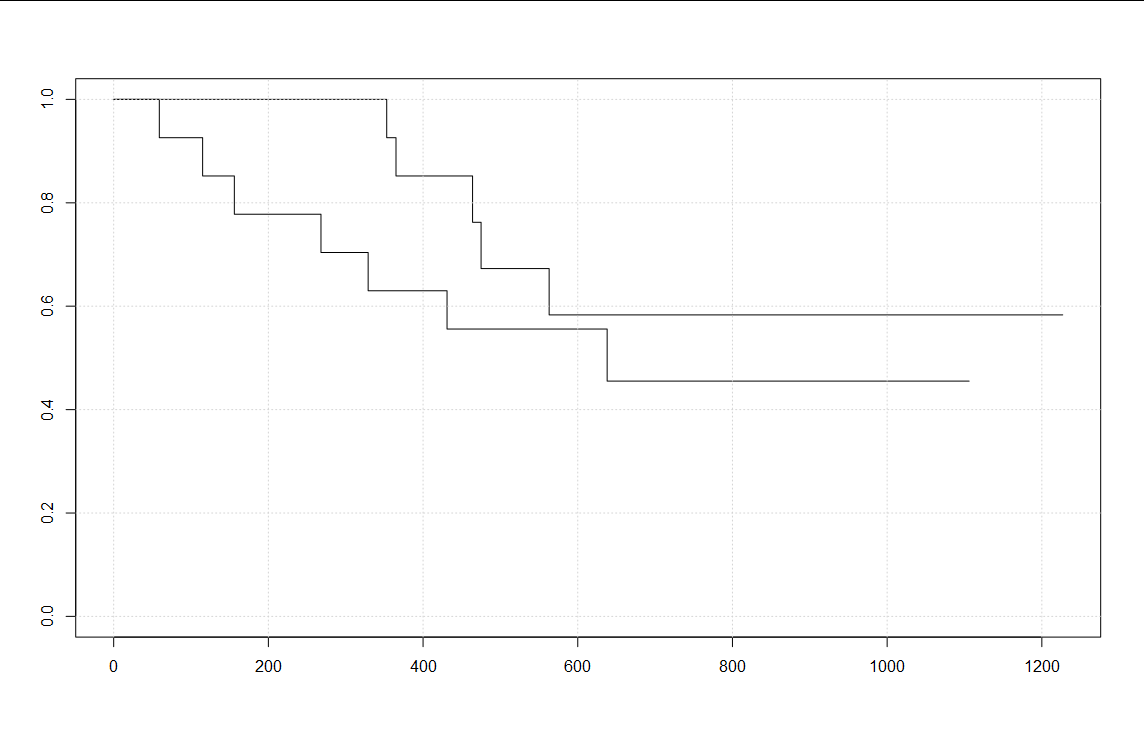
  1. Kaplan-Meier
plot(survfit(Surv(time = futime, event = fustat) ~ rx, data = ovarian))
grid()

enter image description here

With strata(rx) I get exactly the same. OK.

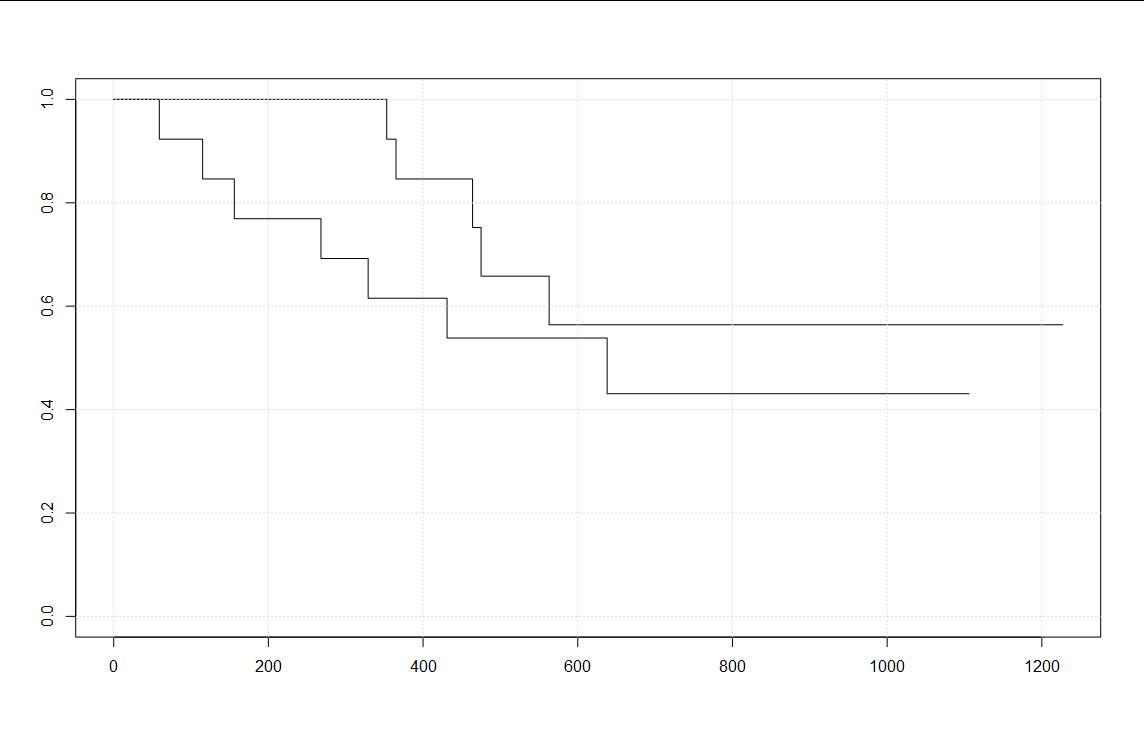
  1. Now I fit Cox with strata(rx):
    m <- coxph(Surv(futime, fustat) ~ strata(rx), data = ovarian) 
    plot(survfit(m))
    grid()

enter image description here

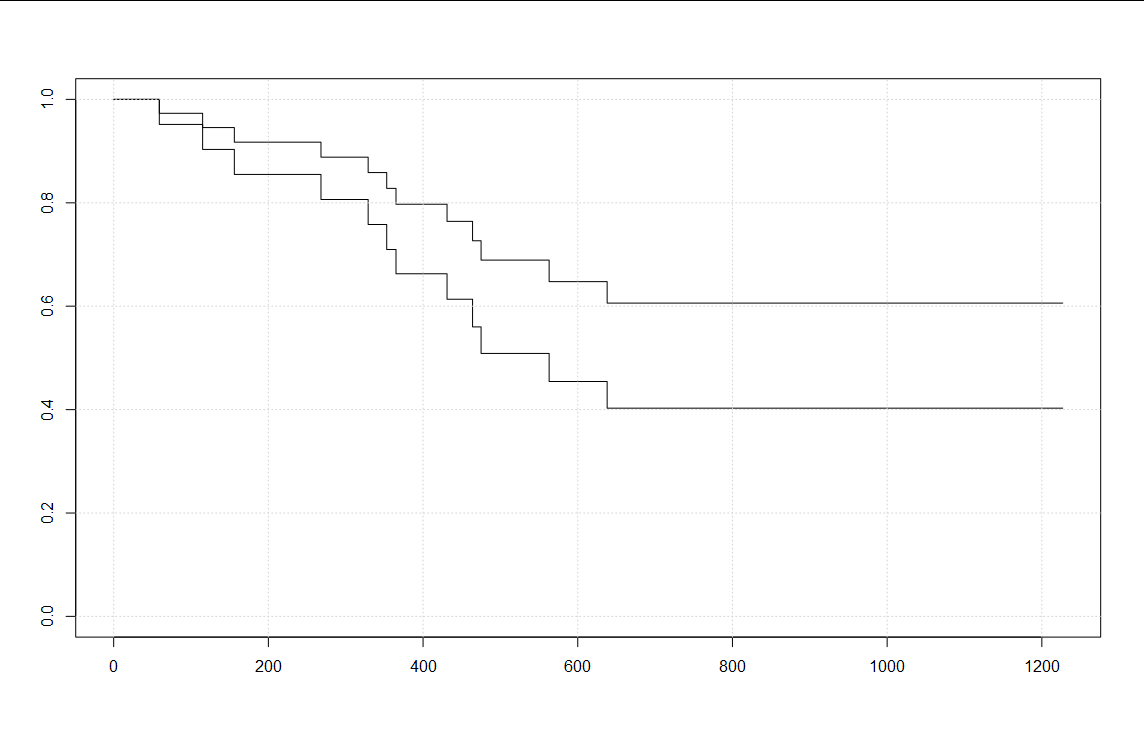
  1. Now I fit Cox with covariate
    m <- coxph(Surv(futime, fustat) ~ rx, data = ovarian) 
    d <- data.frame(rx = c(1, 2))
    
    plot(survfit(m, newdata = d))
    grid()

enter image description here

And this is completely different. I overlaid them: enter image description here
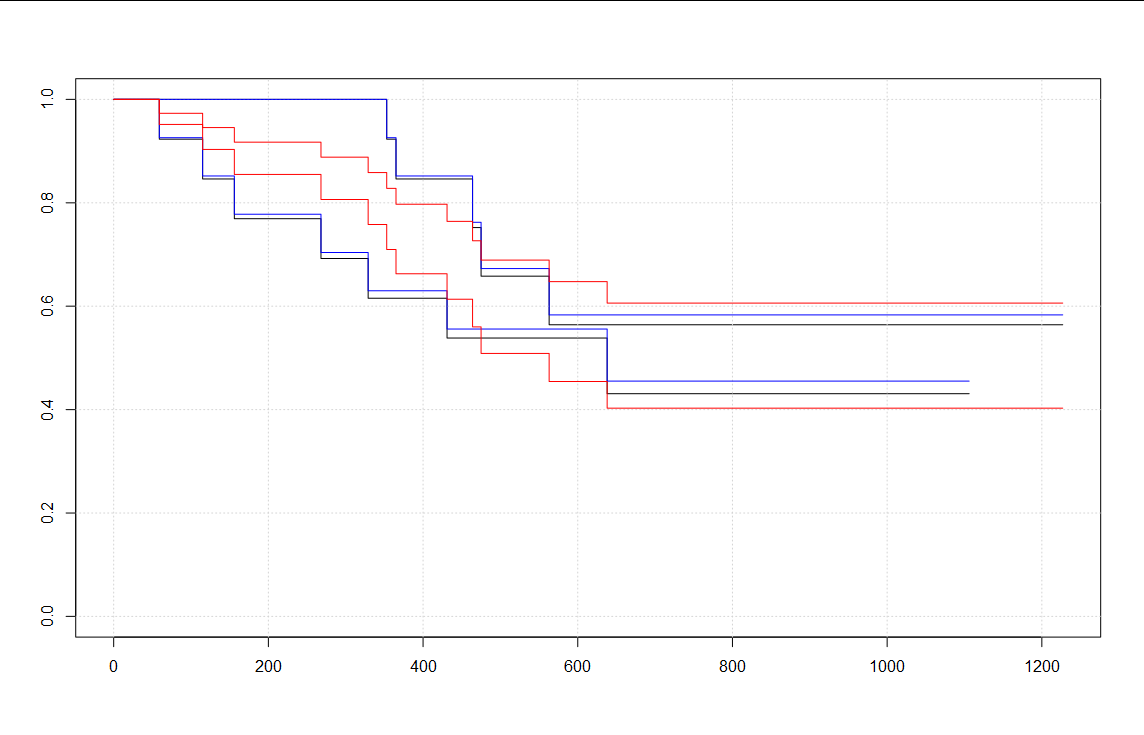
Why do I get so different results, and even Cox with strata != Kaplan-Meier exactly?

How do I get the HR for the Kaplan-Meier, if Cox with strata (closest to it, not exactly) DOES NOT estimate it?


EDIT: OK, it seems that if I want to compare cures, it cannot not be stratified, so I should plot the KM directly from the Cox with the covariate.

$\endgroup$

1 Answer 1

3
$\begingroup$

In the Cox model fit by ~ strata(rx), the Kaplan Meier curve matches the plotted Cox model output exactly or almost exactly -- I'm struggling to see the difference, but discrepancies may arise in terms of how the Cox model handles ties even though there's no covariate in the model. This is because each level of rx is permitted a distinct baseline hazard function and the KM curve is the non-parametric MLE of the survivor function. There is no actual covariate in this model, as the coefficient output would show.

Contrast with the Cox model fit by ~ rx. Now, there is only one baseline hazard function, and it is the hazard when rx=0. However, each distinct value of rx differs from the baseline hazard function according to the hazard ratio which is a constant. So the plotted output shows the predicted survival curve for each distinct value of rx which appears to be binary. Additionally those curves are "parallel" (on the cloglog scale). Furthermore, unlike the KM curve, the steps occur for failures at any point in the analysis, regardless of the value of rx, because the partial likelihood of the Cox model allows you to borrow information about the baseline hazard function whenever a failure occurs in any group.

$\endgroup$

Your Answer

By clicking “Post Your Answer”, you agree to our terms of service and acknowledge you have read our privacy policy.

Not the answer you're looking for? Browse other questions tagged or ask your own question.