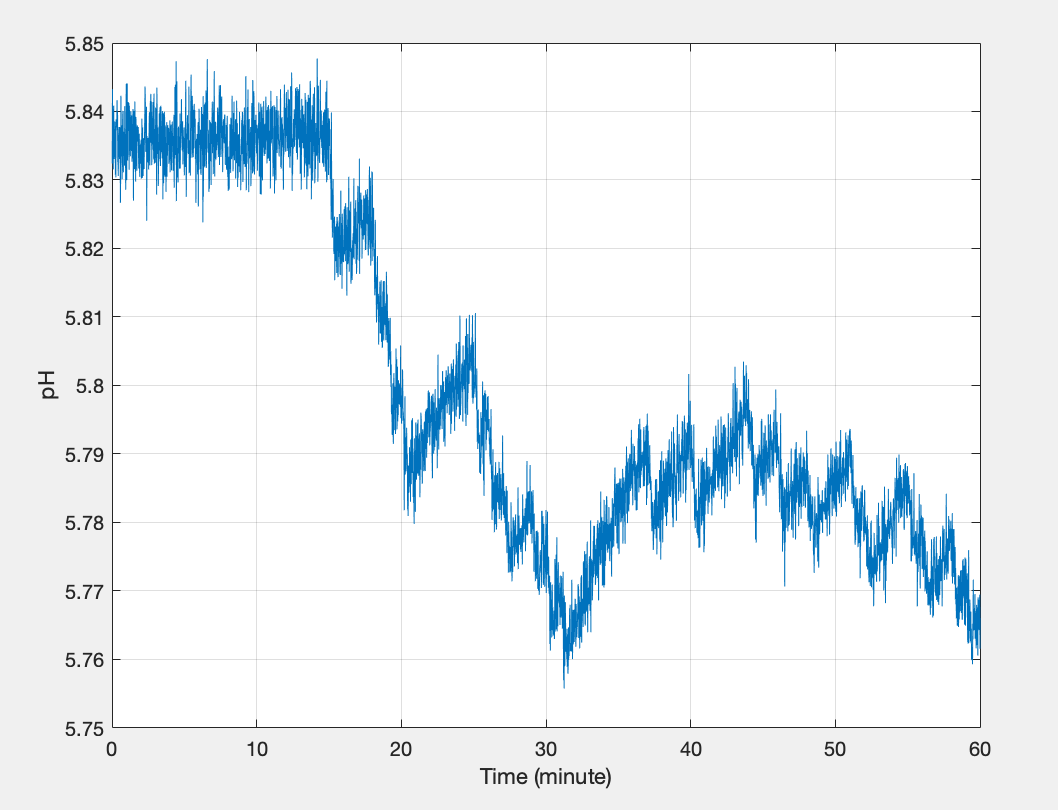
I have these data, related to value of pH over time:
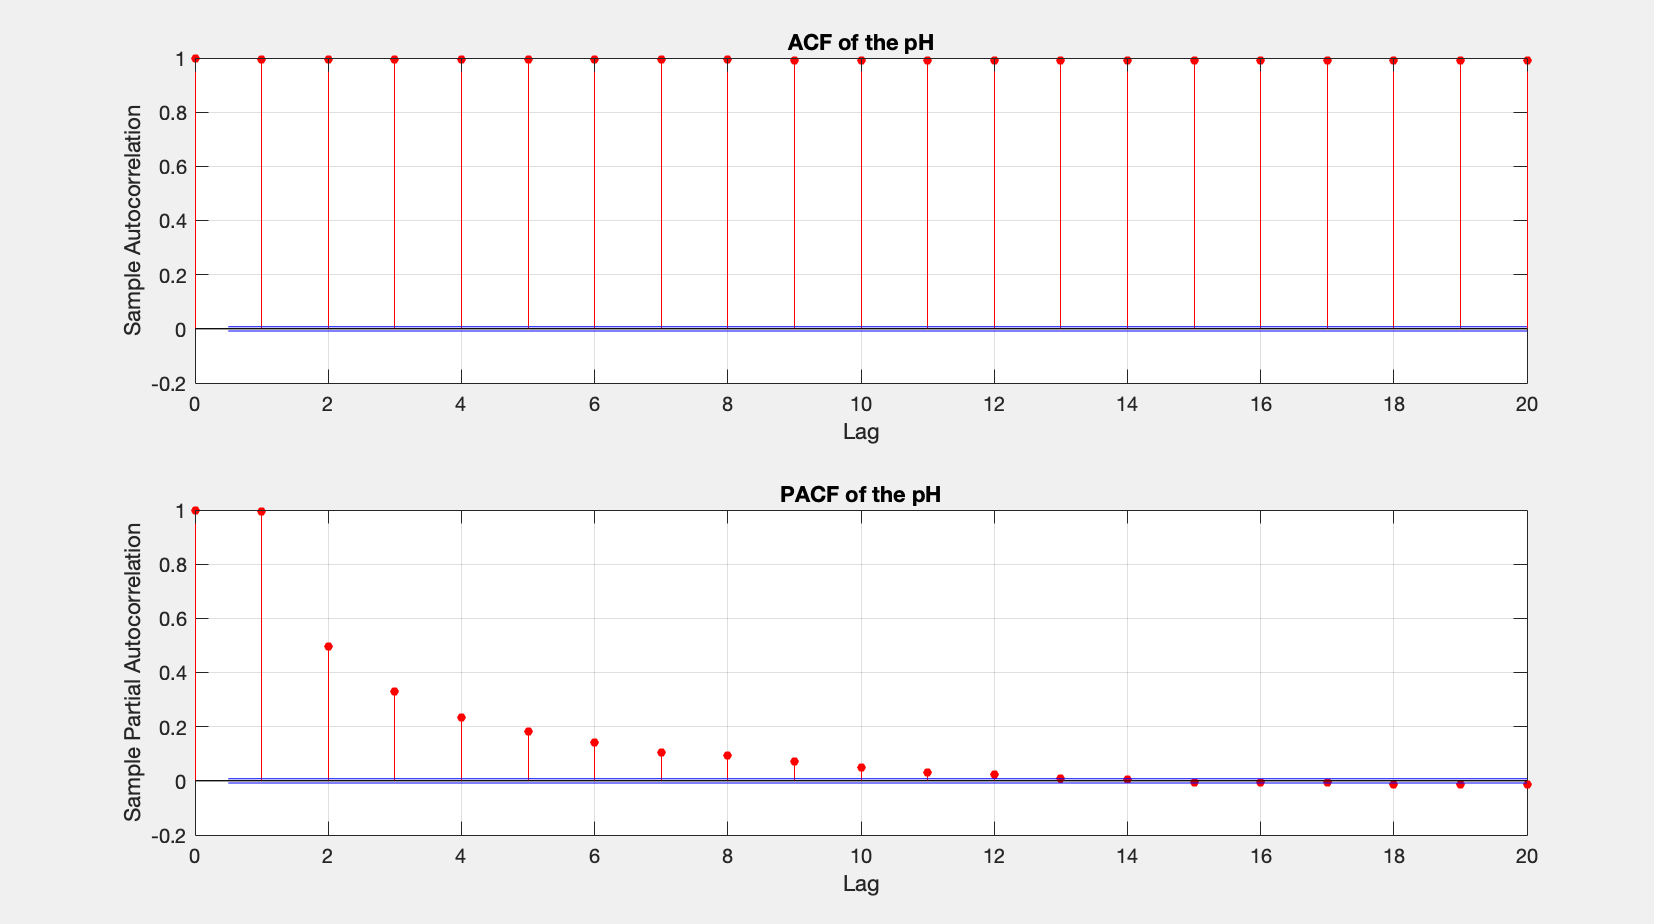
 I want to generate a stochastic model (ARMA, ARMAX, and so on), and I want to decide the order of this model, so I did the plots of ACF and PACF, because I know that when the value of PACF goes essentially to 0, that is the order of the model. But I cannot interpret these plots, because I think some pre-processing steps are required.

$\begingroup$
$\endgroup$
3
-
$\begingroup$ The data does not look stationary. Did you run a unit root test on the data? Before you do anything else you have to make it stationary. I would run auto.arima in the forecast package and see what it tells you as a starting point. I am confused what you mean by stochastic, the data is either that or its deterministic. You have to know that, there is no statistical way I know to determine this. $\endgroup$– user54285Commented May 14, 2021 at 22:25
-
$\begingroup$ Ok, right, I will make my data stationary! $\endgroup$– CasellaJrCommented May 15, 2021 at 7:58
-
$\begingroup$ auto.arima in the forecast package is of MATLAB or R? $\endgroup$– CasellaJrCommented May 15, 2021 at 8:05
Add a comment
|
