0
$\begingroup$

I have two samples of size 20 and I want to see if the difference between the geometric means is significant using two-sample t-statistic and bootstrap sampling.

Here is what I'm doing

# assume we have sample_A and sample_B and number of repetitions for bootstrap sampling is 100

num_repetitions = 100

# sample_A
sample_A_geometric_means = []

for i in range(num_repetitions):
   # randomly sample from sample_A with replacement and the same size 
   s = np.random.choice(sample_A, size=len(sample_A))
   
   # calculate geometric mean
   geom_mean = geometric_mean(s)
  
   sample_A_geometric_means.append(geom_mean)

# do the same for sample_B and get sample_B_geometric_means

# calculate the two-sample t-statistic with sample_A_geometric_means and sample_B_geometric_means

t_stat = two_sample_t_test(sample_A_geometric_means, sample_B_geometric_means)

If I run this multiple times with different random seeds, geometric means vary a lot as I'm using bootstrap sampling. This in turn makes t-stat vary quite widely. Sometimes it is less than 2 but other times is greater than 4.

  1. How should I reconcile this? What t-stat value should I be reporting? If every time I run this and get a very different t-stat value, what does it say about the process?

  2. Is there another method to show if the difference between the geometric means of the two samples significant?

$\endgroup$
5
  • 2
    $\begingroup$ (1) $B = 100$ bootstrap re-samples may not be enough for stable bootstrap results. (2) I wonder why you're using t statistic for a bootstrap of geometric means. (3) You don't say anything about your data, but geometric means are only for non-negative data. (4) Partly on theoretical grounds and partly based on experience, I prefer to use bootstraps for CIs, and permutation tests for testing hypotheses. It seems to me you're mainly interested in a test. // Is this a course assignment in which the method is specified, or a practical application in which you're free to choose methods? $\endgroup$
    – BruceET
    Commented Jun 2, 2021 at 21:15
  • $\begingroup$ I'm using geometric means because the samples represent collection of annual returns of a portfolio. For example - returns for each year between 1981-2000. At the end of the day I want to compare and see if annualized return for this period (geometric mean of 20 yearly returns) for two strategies is significantly different or not. No this is not a course assignment. I'm free to chose any method. $\endgroup$
    – kyc12
    Commented Jun 2, 2021 at 21:46
  • $\begingroup$ Regarding using B = 100, I can use 1000 but I see a similar behavior. Also, the t-stat jumps in the range of 7-11. $\endgroup$
    – kyc12
    Commented Jun 2, 2021 at 21:49
  • $\begingroup$ Do you have any suggestions on which other metric could be used? $\endgroup$
    – kyc12
    Commented Jun 2, 2021 at 22:30
  • $\begingroup$ Yes. Ratio of geometric means. See my answer just posted. $\endgroup$
    – BruceET
    Commented Jun 2, 2021 at 22:54

1 Answer 1

1
$\begingroup$

Maybe I can start by showing you a permutation test for the ratio of the geometric means of two samples of size 20 from two different gamma populations (which, of course, have positive support).

set.seed(2021)
x1 = rgamma(20, 5, .10)
x2 = rgamma(20, 5, .2)

boxplot(x1, x2, col="skyblue2", horizontal=T)

enter image description here

The respective geometric means are $42.06$ and $24.70.$ Their ratio is rto.obs, $1.703.$ Because it seems natural to look at ratios of geometric means, the question is whether $1.703$ is significantly different from $1$ (2-sided test) at the 5% level of significance.

g1 = prod(x1)^.05;  g2 = prod(x2)^.05
g1; g2
[1] 42.06336
[1] 24.69576
rto.obs = g1/g2;  rto.obs
[1] 1.703262

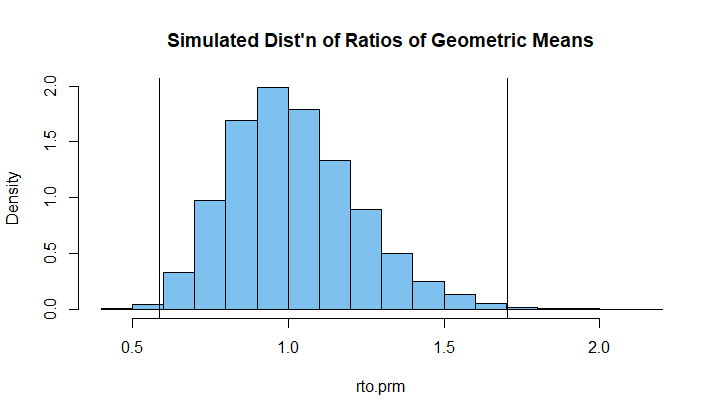
Possibly, one could derive the the distribution of the ratio of gamma geometric means to find an exact test. Instead, I will repeatedly scramble the $n_1+n_2 = 40$ observations into two permuted samples each with $n_i = 20$ observations, find the two geometric means, and then their ratio. After doing this $B = 10\,000$ times, I will have $B$ ratios, which can give me a good idea of the distribution of the ratio. Finally, comparing this simulated permutation distribution of ratios with the observed ratio $1.703,$ I can see whether or not the observed ratio is unusually far from $1.$

set.seed(602)
x = c(x1, x2)
B = 10000;  rto.prm = numeric(B)
for(i in 1:B) {
 x.prm = sample(x)
 rto.prm[i] = prod(x.prm[1:20])^.05/prod(x.prm[21:40])^.05
 }
mean(rto.prm/rto.obs > .975 | rto.obs/rto.prm < .025)
[1] 0.0047  # P-value of sim permutation test.

hdr = "Simulated Dist'n of Ratios of Geometric Means"
hist(rto.prm, prob=T, col="skyblue2", main=hdr)
 abline(v=rto.obs);abline(v=1/rto.obs)

enter image description here

$\endgroup$

Your Answer

By clicking “Post Your Answer”, you agree to our terms of service and acknowledge you have read our privacy policy.

Not the answer you're looking for? Browse other questions tagged or ask your own question.