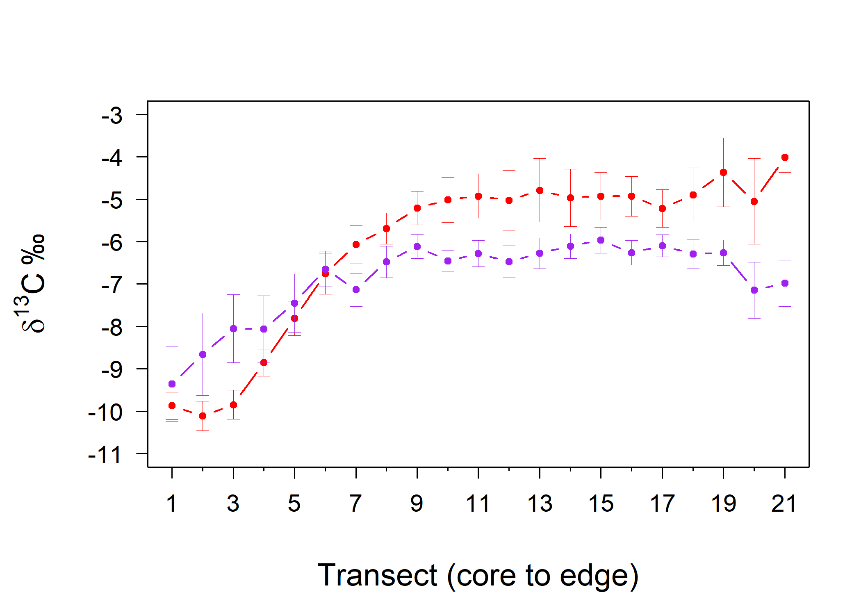
I have 24 time series that are chemical transects from 24 fish otoliths (representing the chemical environment experienced by each fish over the entire life history). Each time series is the same length and all fish were the same age, so each point along the time series corresponds to roughly the same time (age) in each fish's life from birth to death. 12 of the fish were collected in one area (area A) and 12 were collected in another (area B). I want to examine whether the area A fish have a distinct lifetime chemical signature than the fish in area B. I have calculated the average and standard error for each time point for each area and plotted them. The figure below shows the average carbon isotope value for fish from area A (red) and area B (purple) with standard error bars (bars are a little wonky due to image resolution).
Visually, it is clear that the two areas differ, especially at the beginning of the time series and after some transition period. I could run t-tests at each time point to determine where the two areas are significantly different, but I know this is not appropriate as it does not take into account the time series nature of the data. It was suggested that I try doing a bootstrap across the series and calculating confidence intervals but I can't quite figure out how to do that in R. Is this the best method for accomplishing my goal? If so, how do I get started in R?

