6
$\begingroup$

I have two lists with many millions of values (one has 21,410,024,757 values and the other 10,561,427 values). When I run the two-sample KS test the p-value is 0, but many posts suggest that for such large datasets the KS test isn't reliable, e.g: Kolmogorov-Smirnov test statistic interpretation with large samples

Is it a good approach to sub-sample the two lists of values randomly and uniformly?

$\endgroup$
9
  • 5
    $\begingroup$ Why do you want to subsample, to raise the p-value? Why? $\endgroup$
    – Dave
    Commented Jun 28, 2021 at 18:58
  • 14
    $\begingroup$ You misinterpret the posts. The KS test is extremely reliable with such large datasets: and because no two huge datasets have the same distribution (except when artificially generated), the result is a foregone conclusion. That is, the KS test is superfluous with large datasets because you already know the result. $\endgroup$
    – whuber
    Commented Jun 28, 2021 at 19:40
  • $\begingroup$ @whuber thanks, I understand this point. But in terms of how different are two distributions, my understanding is that the KS test would exaggerate the dissimilarity because it takes the max difference instead of the overall difference. $\endgroup$
    – Vasilis
    Commented Jun 28, 2021 at 21:06
  • $\begingroup$ @Vasilis If you subsampled and got the same max difference between the CDFs, how would you interpret that? $\endgroup$
    – Dave
    Commented Jun 28, 2021 at 21:13
  • 5
    $\begingroup$ The KS test does not exaggerate anything; but it is true that it detects differences anywhere along the quantiles. It sounds like what you are looking for is not a test, but a way to examine and compare distributions in detail. Have you considered probability plots? The immediate objection is that you don't want to make a plot of billions of points--but there are shortcuts. The simplest shortcut is to subsample the data, but for more ideas see : see stats.stackexchange.com/questions/35220. $\endgroup$
    – whuber
    Commented Jun 28, 2021 at 22:01

4 Answers 4

9
$\begingroup$

In effect what you are asking for is a p-hack.

The KS test is not "unreliable" with large $n$. Quite the opposite. It is overly powered. What does the KS tell you? If two distributions are different. Lots of data means lots of power. And you now have evidence that the first population with a sample of 21 million is different than the second population with a sample of 10 million. I don't think we should be surprised by this.

The problem is that you didn't think about this before running the test. If you now set the alpha level to some very low value, you are forced to decide whether to set this value to call the test significant or non-significant, you already know the p-value. It begs the question why run the test at all?

Also a note about reporting p-values. A p-value is never 0. Even when the sample is identical in the two arms, as a formality, you should report the p-value as p < 0.001 (or whatever significant figure you choose to report p-values); declaring something to be impossible can lead to a serious diagnosis of foot-in-mouth syndrome.

I find that tests are not useful summaries of distributional differences. It's surprising how informative graphics can be to summarize these values instead. Consider simply showing two overlayed estimates of the density using a filtering process. That was if the "difference" leading to a significant result is some small, ignorable facet, then the graph tells us there is no practical difference to mind.

$\endgroup$
6
  • 2
    $\begingroup$ This is not what "p-hacking" means, and what the OP is considering is not p-hacking. What the OP is looking for is a way to decide whether the observed differences in the distribution are important enough to be concerned about. The proposed solution of subsampling is a bad use of statistics, but not every bad use of statistics is "p-hacking". $\endgroup$
    – Nobody
    Commented Jun 29, 2021 at 12:20
  • 1
    $\begingroup$ @Nobody if we want to get down to brass tacks, p-hacking doesn't mean anything at all. It's just another vaguery that emerged in the era of "data science". The general problem is the same: you modify an automated procedure to get a result that depends on "personal preference"; (many people do KS to show distributions are the same, two sins at once). However, even an elementary statistics education should lead you to understand that you can't decide the parameters of the test after running it. Also subsampling from a SRS is no different that resetting the level of a test. $\endgroup$
    – AdamO
    Commented Jun 29, 2021 at 15:07
  • $\begingroup$ If "p-hacking" has no meaning, then we probably shouldn't be saying it at all, since it only serves to obfuscate, rather than elucidate, right? In fact, I think the behavior commonly described as "p-hacking" is both prevalent and important enough to have a term to describe it. What is happening with the OP has a different motivation AND a different remedy from what we normally call "p-hacking"; therefore, it isn't useful to use the same word to describe it. $\endgroup$
    – Nobody
    Commented Jun 29, 2021 at 16:13
  • $\begingroup$ @Nobody if you're so convinced, why not answer how, if at all, subsampling actually provides a "solution" to the "problem" of having "too much data". $\endgroup$
    – AdamO
    Commented Jun 29, 2021 at 16:51
  • $\begingroup$ If you read my answer below, my answer is to consider what question you want to ask of the data, and run a test that answers that question. It really is worth taking a moment to understand the difference in these two situations. In the case of (true) p-hacking, you are asking a question and trying to make the test give you the answer you want (usually because you need that answer in order to publish). The important thing is that in these cases there is no legitimate problem to solve; you need to just accept that your data don't show what you'd hoped they would. In the OP's case... $\endgroup$
    – Nobody
    Commented Jun 29, 2021 at 17:05
7
$\begingroup$

Can you say the source of the data and what practical goal you hope to reach doing a K-S test on these two huge samples.

in particular:

  • With such large datasets, you should be able to see some obvious differences between the the two samples, unless they are essentially from the same distribution,

  • Why would a P-value of $\approx 0$ unsatisfactory for your purposes?

  • A major complaint about the K-S test is that it sometimes detects differences not of practical importance when sample sizes are very large.

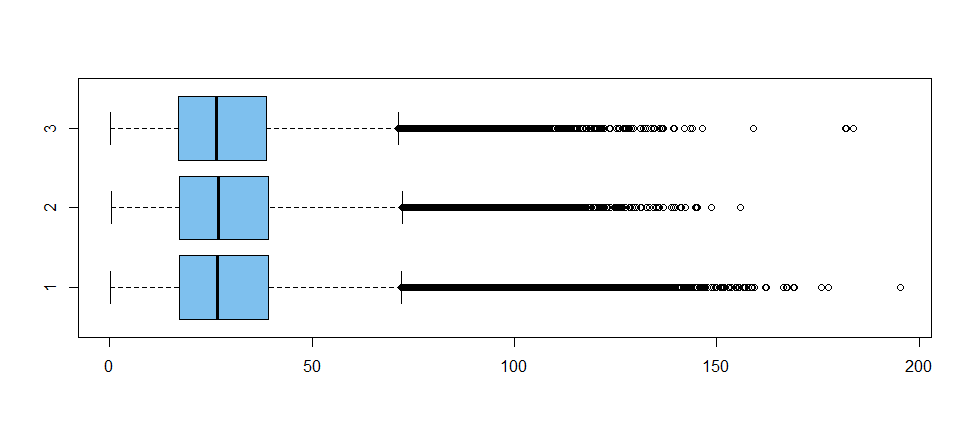
Consider the following, using R:

set.seed(2021)
x1 = rgamma(10^6, 3, .1)
x2 = rgamma(10^5, 3, .1)
x3 = rgamma(10^5, 3, .101)
ks.test(x1, x2)

        Two-sample Kolmogorov-Smirnov test

data:  x1 and x2
D = 0.003331, p-value = 0.2654
alternative hypothesis: two-sided

ks.test(x1, x3)

        Two-sample Kolmogorov-Smirnov test

data:  x1 and x3
D = 0.008329, p-value = 6.656e-06
alternative hypothesis: two-sided

mean(x1); mean(x2); mean(x3)
[1] 30.00744
[1] 30.0714
[1] 29.70087
boxplot(x1,x2,x3, col="skyblue2", horizontal=T)

enter image description here

$\endgroup$
4
  • $\begingroup$ Thanks for the reply. At least when plotting the two distributions, they look very similar so I think it's your third point, i.e. a case of exaggerating unimportant differences. So my idea was that this sub-sampling (repeated multiple times) would remove the impact of these small differences $\endgroup$
    – Vasilis
    Commented Jun 28, 2021 at 21:17
  • $\begingroup$ The source of the data is number of items purchased in a single transaction in a very large e-shop. The one dataset contains data only for customers in a single country, while the other dataset contains data from all the other countries together. $\endgroup$
    – Vasilis
    Commented Jun 28, 2021 at 21:29
  • $\begingroup$ Thanks for info. Based on that I'm not surprised there are some differences between the two samples. Maybe methods of time series would help you find meaningful components of difference. $\endgroup$
    – BruceET
    Commented Jun 29, 2021 at 1:40
  • $\begingroup$ While that major complaint is made, it is a feature, not a bug, of hypothesis testing. (You know this, but not every reader will.) $\endgroup$
    – Dave
    Commented Jul 16, 2021 at 10:50
3
$\begingroup$

The problem with your proposed solution is that there is no good way to determine how much downsampling you should do to get the "right" answer. Reducing the sample size will reduce the power of the test, but you have no idea how much reduction is needed. The deeper problem is that the K-S test is telling you whether there is statistical evidence for a difference between the distributions, but what you want to know is, whether the difference is important enough to be concerned about it. The K-S test can't tell you this.

The first thing you are going to have to do to answer that question is to decide what kinds of differences you care about. Do you want to know if the means are different? The variances? The 95th percentiles? Statistics can't answer this for you. You have to do some thinking about what kinds of differences would cause you to do something different in your business. Then devise tests for those differences specifically.

What form the tests you are looking for are going to take depends a little on what kinds of differences you are looking for, but generally speaking you are going to want to avoid hypothesis tests and look for estimates of confidence intervals for the population parameters you are interested in. So, for example, if you are interested in whether the mean of one distribution exceeds the other by some particular margin (which you have predetermined is relevant to your business use), you might start with the standard error of the means of the distributions and use them to estimate the standard error of the difference between the means. If you're interested in something more esoteric, you might have to fit some parametric distributions to the data, or use a bootstrap Monte Carlo. Whatever you method you pick, you will need to keep its assumptions and limitations in mind and make reasonably certain that your data doesn't violate them.

The most important thing, however, is to start by thinking about what it is you are really looking for. Why do you care whether the distributions are different? Trying to run statistical tests before you've thought about that is futile.

$\endgroup$
0
$\begingroup$

I wonder, how you have such a huge data. Any way, as I understand, your primary interest is to know whether the distribution pattern is same in both the data or not? I think, it is better, if you resort to some sort of sampling. it is not always possible to enumerate the entire population or huge population and as is not cost-effective, sampling is always advocated. I suggest that you have relatively a small random sample of the data ( say 10,000 each) and then go for the analysis. Form a frequency distribution for both the sampled data and then go for K-S test or the Chi-square test, as desired.

$\endgroup$
2
  • $\begingroup$ This answer is incorrect, because the p-values for a subsample will be wrong. $\endgroup$
    – whuber
    Commented Jul 16, 2021 at 11:49
  • $\begingroup$ Whenever data is huge, researcher resort to sampling. 1% sample registration scheme, shortly known as 1% SRS is used to estimate various fertility parameters in India and released from time to time. So, adopting sampling using proper method is quite cost effective and time saving. Of course, sampling has its own limitations also. One has to compare the gain versus the loss in going for the sampling. $\endgroup$ Commented Jul 18, 2021 at 4:27

Your Answer

By clicking “Post Your Answer”, you agree to our terms of service and acknowledge you have read our privacy policy.

Not the answer you're looking for? Browse other questions tagged or ask your own question.