21
$\begingroup$

Are SHAP (SHapley Additive exPlanations) values potentially misleading when predictors are highly correlated? How and why? If so, is there any guidance on when not to use SHAP? Are there any rules of thumb based on $\mathbf{Var}\left[X\right]$ telling us when features are too correlated for SHAP?

I'm interested in a regression setting where $X \in \mathbb{R}^p$ is a $p$-dimensional vector of predictors (aka features), and we are using SHAP to understand the behavior of a nonlinear regression model $f(X)$ which allows interactions. Suppose $f$ is a gradient boosted regression tree, for example.

Motivation:

  • https://christophm.github.io/interpretable-ml-book/shapley.html#disadvantages-13 states that "Like many other permutation-based interpretation methods, the Shapley value method suffers from inclusion of unrealistic data instances when features are correlated. To simulate that a feature value is missing from a coalition, we marginalize the feature. This is achieved by sampling values from the feature's marginal distribution. This is fine as long as the features are independent. When features are dependent, then we might sample feature values that do not make sense for this instance."
  • https://youtu.be/B-c8tIgchu0 (a presentation about SHAP given by Scott Lundberg) touches on this question. Around 10:50, the presenter says "in practice what happens is you often assume independence between different input features in order to calculate the conditional expectation."
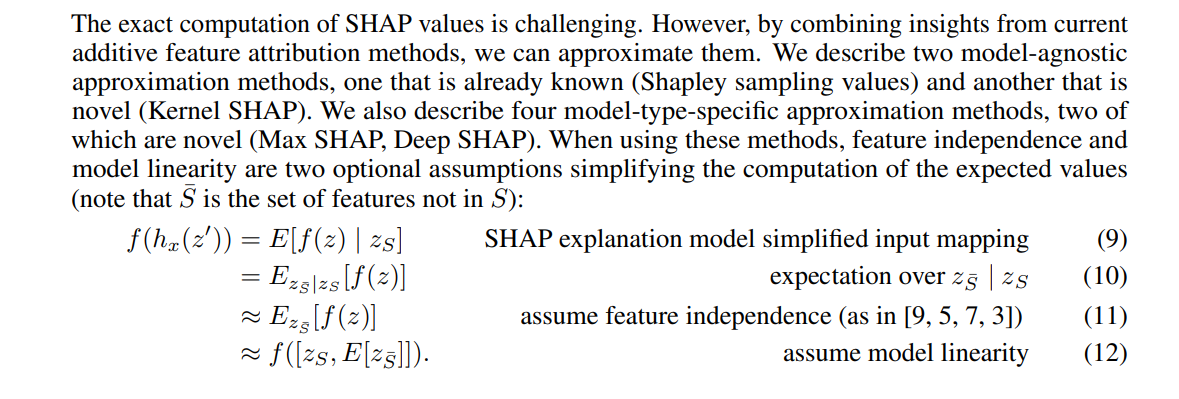
  • https://arxiv.org/abs/1705.07874 (A Unified Approach to Interpreting Model Predictions by Scott Lundberg and Su-In Lee) notes that many methods "assume feature independence" in equation 11. Screenshot:

SHAP Paper

Edit: Mase et al.'s paper (linked by cardinal in a comment below) is quite relevant to this question:

Mixing and matching the components of $x_t$ and $x_b$ presents some problems. The variables $x_{ij}$ and $x_{ik}$ may show a strong correlation over subjects i = 1, . . . , n. Putting $x_{tj}$ and $x_{bk}$ into a single hypothetical point may produce an input combination far from any that has ever been seen. Beyond being unusual, some combinations are physically or even logically impossible. The changes might produce a hybrid data point representing a patient whose systolic blood pressure is lower than their diastolic blood pressure. Somebody’s birth date could follow their graduation date. When hospital records show minimum, maximum and average levels of blood oxygen, the hybrid point could have mean O2 below minimum O2, or it could have minimum and maximum that differ along with a variable saying they were only measured once (or never). There could be important reasons to understand effects of longitude and latitude separately, but some combinations will not make sense, perhaps by placing a dwelling within a body of water. When the function $f(·)$ that made a decision was trained, it would have seen few if any impossible or extremely unlikely inputs. As a result, its predictions there cannot have been regularized suitably. Investigators should be able to choose an importance measure that does not rely on any such values.

$\endgroup$
2
  • 5
    $\begingroup$ You might look at Mase, et al. (2020) which (1) presents a refinement of SHAP that avoids impossible -- and, thus, implausible -- feature combinations and (2) rather directly addresses the case of highly correlated features. Their solution leads to equal importance under perfect correlation (similar to what happens with ridge regression coefficients in the presence of perfect collinearity), though I think there are ultimately some extra-statistical considerations to make when evaluating whether such "importance sharing" makes sense for your application. $\endgroup$
    – cardinal
    Commented Jul 23, 2021 at 2:10
  • 2
    $\begingroup$ I second the original question. Is there a suggested/established feature correlation threshold above which SHAP values could be misleading? $\endgroup$
    – dean
    Commented Dec 8, 2021 at 23:09

2 Answers 2

8
$\begingroup$

Summary

Yes, SHAP values are potentially misleading when predictors are correlated -- they can be imprecise and even have the opposite sign.

The correlation does not need to be incredibly high, around roughly 0.2, we already see large deviations from true SHAP values arising due to the independence assumption.

Detailed answer

This paper by Aas et al. (2021) answers your questions, so I will include quotes from it (italicized):

The original Shapley values do not assume independence. However, their computational complexity grows exponentially and becomes intractable for more than, say, ten features.

That's why Lundberg and Lee (2017) proposed using an approximation with the Kernel SHAP method, which is much faster, but assumes independence as you correctly mention.

However, as the Mase et al. quote you mention shows, independence is rarely the case in real-world data. Assuming independence causes Shapley values to suffer from inclusion of predictions based on unrealistic data instances when features are correlated.

To your question:

Are SHAP (SHapley Additive exPlanations) values potentially misleading when predictors are highly correlated? How and why? If so, is there any guidance on when not to use SHAP? Are there any rules of thumb based on Var[X] telling us when features are too correlated for SHAP?

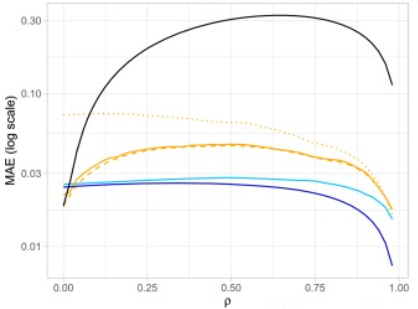
Yes SHAP values assuming independence may be misleading. Aas et al. show using simulations that while the Kernel SHAP method is accurate for independent features, for correlations higher than about 0.05, SHAP values give results further and further from the true Shapley value.

On the graph below, the black line shows the average difference between the true Shapley value and its approximation. The yellow, teal and purple lines represent errors from alternative SHAP calculations the authors propose (these do not assume independence).

Departure from true Shapley values

According to the simulations, even for small correlations (0.05), it is more precise to calculate SHAP values by not assuming independence. One might try to calculate "standard" SHAP values and also ones not assuming independence and comparing the results. This can be done via the shapr package written in R.

I'm interested in a regression setting where X is a p-dimensional vector of predictors (aka features), and we are using SHAP to understand the behavior of a nonlinear regression model f(X), which allows interactions. Suppose f is a gradient boosted regression tree, for example.

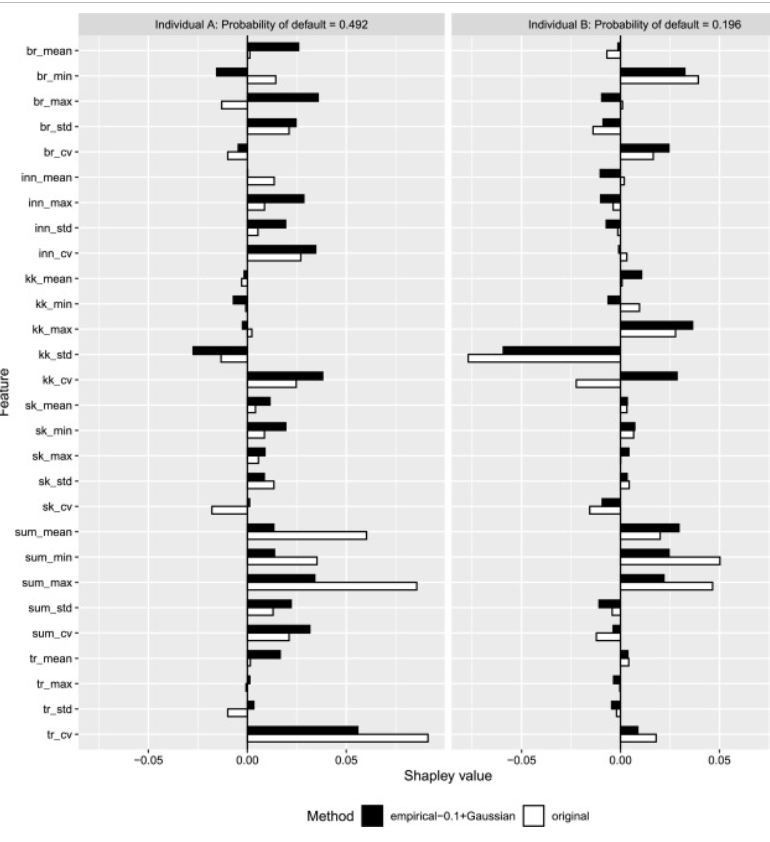
In an example using a real dataset, the authors use XGBoost to predict mortgage default using transactional data. The dataset has 28 features, some of which, such as br_mean, br_min, br_max (mean, minimum, and maximum balance on a checking account in 365 days) are correlated.

They calculate SHAP values for 2 individuals using the Kernel SHAP method (assuming independence, see white bars) and using an alternative they propose which doesn't require independence (see black bars). The resulting SHAP values are quite different for the correlated values and sometimes even have opposite signs -- for example for Individual A br_min and br_max.

SHAP values 2 individuals

$\endgroup$
3
  • 2
    $\begingroup$ Minor correction: correlation is not % of anything. $\endgroup$
    – Tim
    Commented Apr 21, 2023 at 20:16
  • $\begingroup$ Thank you, fixed. $\endgroup$
    – Dudelstein
    Commented Apr 23, 2023 at 18:30
  • $\begingroup$ Are you sure that the problem is related with the number of features? It seems to me that the problem is the estimation of the conditional expectation, which is only possible when independence is assumed. Note that, in general, for a given combination of feature values, there are not enough instances to estimate an expectation conditional on these precise values. This means that, even for only a few features, the exact Shapley values cannot be estimated from the data. $\endgroup$
    – cdalitz
    Commented Oct 29 at 14:26
6
$\begingroup$

By default, TreeExplainer in the SHAP (SHapley Additive exPlanations) library uses feature_perturbation = "interventional". This choice is based on the work by Janzing et al. (2020) which addresses the misconception regarding the use of conditional expectation in SHAP values.

According to Janzing et al. 2020, the author argue

... Our arguments are phrased in terms of the causal language introduced by Pearl (2000). We argue that parts of the package SHAP from Lundberg and Lee (2017) are unaffected by this misconception (although the corresponding theory part of the paper suffers from this issue) since they ‘approximates’ the observational expectations by an expression that would have been the right one in the first place.

In their work, Janzing et al. elaborate on the flaws of using conditional expectation and emphasize the importance of interventional expectation. However, they find that the usage of TreeExplainer in the SHAP package is appropriate and aligns with the correct approach.

In summary, if you are using the TreeExplainer in the SHAP library, you can have confidence in the correctness of the SHAP values it provides, as it accounts for interventional expectations as recommended by Janzing et al.

The source code is here for your perusal.

$\endgroup$

Your Answer

By clicking “Post Your Answer”, you agree to our terms of service and acknowledge you have read our privacy policy.

Not the answer you're looking for? Browse other questions tagged or ask your own question.