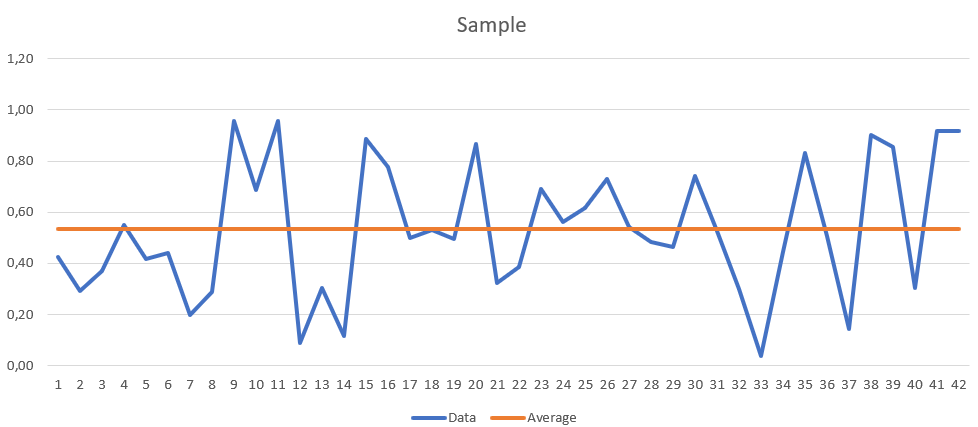
I've been struggling to understand how I should actually calculate the MA model, in particular - what mean do I take? In Wikipedia there's the formula:
$$ X_t = \mu + \varepsilon_t + \theta_1\varepsilon_{t-1} + \dots + \theta_q\varepsilon_{t-q} $$
in which as far as I understand the Mu is the population mean, which leads me to believe that it could be visualised this way:

and carrying out simple =linest function (forgive me for nonenglish excel version) leads us to MA(3):
My first question here - is my model correct? Can you see if I have misunderstood something?
My second question: While carrying out ARMA model, do I simply add the columns with lagged values like this?:
Or am I supposed to use the residuals of AR model as inputs to the MA part? This part is the most confusing to me, because I was learning how to do that by coding, which I feel didn't give me enough insight into the actual calculations.
PS: Please don't worry about the parameters I used, I'm aware of the necessity of testing the data before doing anything and I only used excel screenshots to express exactly where my problem is.


