I have several cell cultures at different salinities. I have 4 replicates at each salinity. You can get an example of the data, with 2 salinities, here:
ID=c("F58.0.1", "F58.0.1", "F58.0.1", "F58.0.1", "F58.0.1", "F58.0.1", "F58.0.1",  "F58.0.1"  ,"F58.0.1"     ,"F58.0.1" , "F58.0.2" , "F58.0.2" , "F58.0.2"  ,"F58.0.2"  ,"F58.0.2"  ,"F58.0.2"  ,"F58.0.2"  ,"F58.0.2"      , "F58.0.2" , "F58.0.2",  "F58.0.3" , "F58.0.3" , "F58.0.3"  ,"F58.0.3" , "F58.0.3"  ,"F58.0.3" , "F58.0.3"      ,"F58.0.3" , "F58.0.3" , "F58.0.3" , "F58.0.4"  ,"F58.0.4"  ,"F58.0.4"  ,"F58.0.4"  ,"F58.0.4"  ,"F58.0.4"       ,"F58.0.4" , "F58.0.4"  ,"F58.0.4" , "F58.0.4"  ,"F58.50.1"     ,"F58.50.1" ,"F58.50.1", "F58.50.1" ,"F58.50.1" ,"F58.50.1" ,"F58.50.1" ,"F58.50.1" ,"F58.50.1" ,"F58.50.1"     ,"F58.50.2", "F58.50.2", "F58.50.2" ,"F58.50.2" ,"F58.50.2" ,"F58.50.2" ,"F58.50.2" ,"F58.50.2" ,"F58.50.2"      ,"F58.50.2", "F58.50.3", "F58.50.3", "F58.50.3", "F58.50.3", "F58.50.3", "F58.50.3", "F58.50.3", "F58.50.3"      ,"F58.50.3", "F58.50.3" ,"F58.50.4", "F58.50.4" ,"F58.50.4", "F58.50.4", "F58.50.4", "F58.50.4", "F58.50.4"      ,"F58.50.4", "F58.50.4" ,"F58.50.4")
salinity=c(0 , 0,  0,  0,  0,  0,  0,  0,  0,  0,  0,  0,  0,  0,  0,  0,  0,  0,  0,  0,  0,  0,  0,  0,  0,  0,  0  ,0  ,0,  0  ,0  ,0  ,0,  0,  0,  0,
            0,  0,  0 , 0 ,50, 50, 50, 50, 50, 50, 50, 50, 50, 50, 50, 50 ,50, 50, 50, 50, 50, 50, 50, 50, 50, 50, 50, 50, 50, 50, 50, 50,
           50, 50, 50, 50, 50, 50, 50, 50, 50, 50, 50, 50)
day=c(0 , 1,  3,  6,  8, 10, 13, 15, 17, 20,0 , 1,  3,  6,  8, 10, 13, 15, 17, 20,0 , 1,  3,  6,  8, 10, 13, 15, 17, 20,0 , 1,  3,  6,  8, 10, 13, 15, 17, 20,0 , 1,  3,  6,  8, 10, 13, 15, 17, 20,0 , 1,  3,  6,  8, 10, 13, 15, 17, 20,0 , 1,  3,  6,  8, 10, 13, 15, 17, 20,0 , 1,  3,  6,  8, 10, 13, 15, 17, 20)

cells=c( 8 , 7,  9 ,13, 19, 20, 20, 19, 18, 21,  8,  8, 10, 21, 26, 25, 33, 40, 51, 71,  8,  7, 10,  8  ,9  ,8  ,5  ,1  ,1,  0,  8  ,7  ,6 ,14 ,16 ,16
         , 23, 30, 37, 42,8,  7 , 7 , 7 , 6 , 5 , 6 , 7 , 6 , 6 , 8 , 6 , 7 , 6 , 7 , 6 , 6 , 6 , 6 , 5 , 8 , 7 , 5 , 4 , 4 , 3 , 3 , 4
,         4 , 4 , 8 , 7 , 7 , 6 , 5 , 5 , 5 , 5 , 4 , 4)
data<-data.frame(ID,salinity,day,cells)
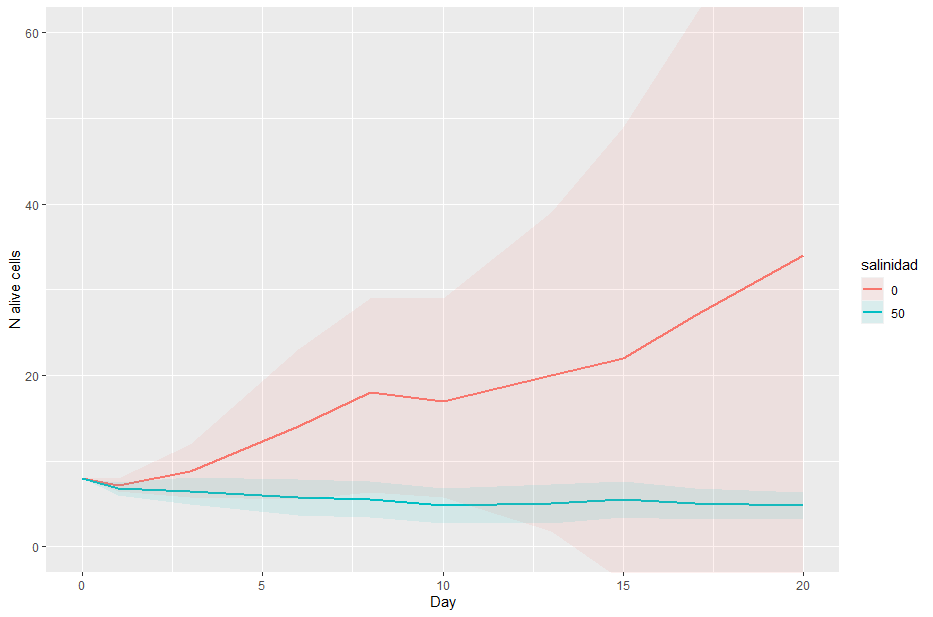
Which looks like this:
The 95% CI at salinity 0 is huge, there was a lot of divergence between replicates. There was also one culture/replicate that didn't work, I tried deleting it, but the CI is even bigger (because then I only have 3 replicates, I guess). Also, I don't know how to statistically detect outliers in this type of data, I don't know if I should really delete it or not.
But the main question is, how can I statistically compare these time series? (the values, the trend...and I don't know what else I should look at). How can I say wether the cells grow different or not at 0 and 50g/L salinity?
I saw a post in which they recommended adding a model and then comparing the models. But I have no experience with this type of data and I don't know which type of model whould I use.

