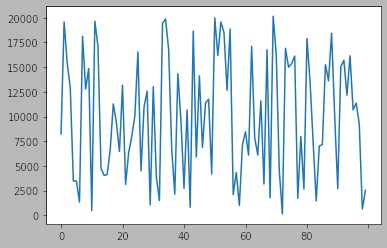
I have a multi-label dataset, whose label distribution looks something like this, with label on x-axis and number of rows it occurs in the dataset in y-axis.
## imports
import numpy as np
import pandas as pd
%matplotlib inline
from sklearn.datasets import make_multilabel_classification

## creating dummy data
X, y = make_multilabel_classification(n_samples=100_000, n_features=2,
                                      n_classes=100, n_labels=10, random_state=42)
X.shape, y.shape
   ((100000, 2), (100000, 100))

## making it a dataframe
final_df = pd.merge(left=pd.DataFrame(X), right=pd.DataFrame(y), left_index=True, right_index=True).copy()
final_df.rename(columns={'0_x':'input_1', '1_x':'input_2', '0_y':0, '1_y':1}, inplace=True)
final_df.columns = final_df.columns.astype(str)

## plotting the counts of each label:
labels = [str(i) for i in range(100)]
value_counts = final_df.loc[:, labels].sum(axis=0)
value_counts.plot(kind='line')

So, there are labels that have occurred only in couple hundred rows, while there are also labels, occurred in 19K+ rows.
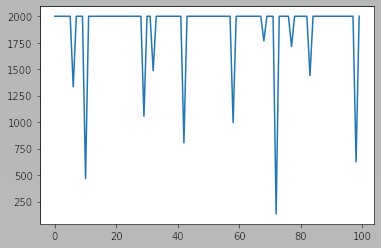
I would now like to undersample it, to make the number of rows each label appear in the dataset, look something like this:

So, a label has to occur, at max in only around 2000 rows(+100 is acceptable), while all the under occurred labels has to be left as is.
I have gone through various under-sampling methods that imbalanced-learn provides, but none of them seemed to support multi-label datasets.
How do I do this?
