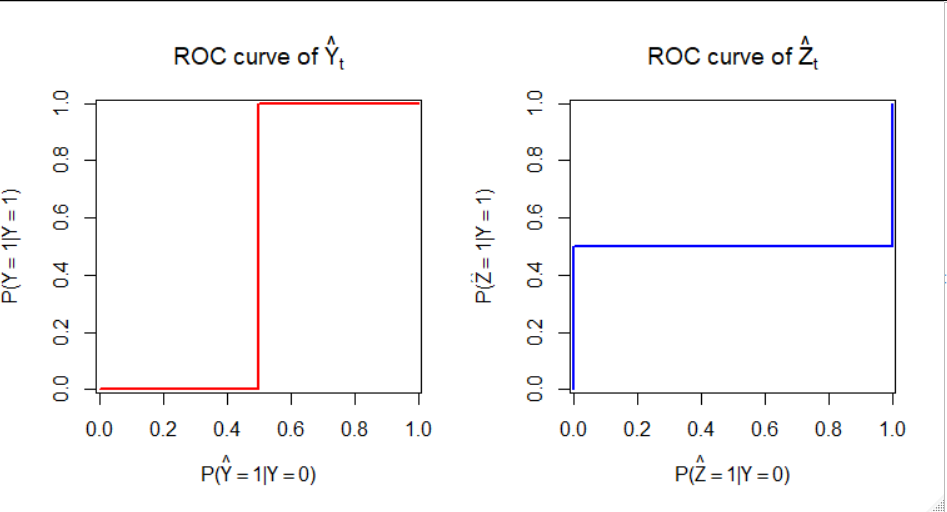
We have two models outputting estimates of class probabilities. Combined with a probability cutoff / threshold, these yield classification decisions: if the estimated probability of class 1 is above the threshold, the assigned label is class 1; otherwise, it is class 0. We want to compare the models in terms of their estimated expected loss for a given threshold. The loss function $L(\hat{Y},Y)$ is given by \begin{aligned} L(0,0)&=0, \\ L(0,1)&=a, \\ L(1,0)&=b, \\ L(1,1)&=0 \end{aligned} with $a,b>0$. The estimated losses on a test subsample are not available. However, we have the ROC curves on the test subsample for each model. From each curve, we can obtain the point that corresponds to the optimal threshold as derived from the loss function. (By optimal threshold I mean the one that minimizes the estimated expected loss. For the general loss function specified above, it is $\frac{b}{a+b}$, assuming the estimated probabilities are reasonably well calibrated.)
Question: Does this pair of points on the ROC curves contain sufficient information to conclude which classification algorithm has the lower estimated expected loss? If not, could you offer a counterexample?
Related question: "Are non-crossing ROC curves sufficient to rank classifiers by expected loss?".

