1
$\begingroup$

My understanding is that we use the logit function to convert the sigmoidal curve of a logistic regression to be linear.

As a result, we go from a curve modeled as P = ea+bX / (1 + ea+bX) to one that can be modeled linearly as logit for p = a + bX.

Why is this important? (why do we need to do this?)

One suggestion I found was that this conversion to log odds shifts the model from being probability based to being a likelihood-based model. IS this true? If so, what value does that hold?

Summary: why do we transform a logistic regression equation to be linear?

$\endgroup$

3 Answers 3

4
$\begingroup$

It's a bit hard to know what you're asking and how to answer it without completely explaining logistic regression, but the sigmoid curve $$ P(Y=1|X) = \frac{e^{a+bx}}{1+e^{a+bx}} $$ and the linear logit regression equation $$ \text{logit}(P(Y=1|X))=a+bx $$ are equivalent ways of writing the same relationship. There is no transformation. The former makes it clear that we are modeling a probability using a sigmoid curve; the latter makes it clear that we are modeling the logit of the probability using a linear function. The two equations emphasize different parts of the relationship, but they express identical information.

To see how, note the definition of the logit: $$ \text{logit}(p) = \text{log}\left(\frac{p}{1-p}\right) = \text{log}(p)-\text{log}(1-p) $$ Inserting the sigmoid model for $p$, we get \begin{align} \text{logit}(P(Y=1|X)) &= \text{log}\left(\frac{e^{a+bx}}{1+e^{a+bx}}\right)-\text{log}\left(1-\frac{e^{a+bx}}{1+e^{a+bx}}\right) \\ &= \text{log}\left(\frac{e^{a+bx}}{1+e^{a+bx}}\right)-\text{log}\left(\frac{1}{1+e^{a+bx}}\right) \\ &= \text{log}\left(e^{a+bx}\right) - \text{log}\left(1+e^{a+bx}\right) + \text{log}\left(1+e^{a+bx}\right) \\ &= \text{log}\left(e^{a+bx}\right) \\ &= a + bx \end{align}

$\endgroup$
3
$\begingroup$

In logistic regression we are not 'making the regression linear'.

Instead, the model is non-linear.

If we assume Bernoulli distribution for the observations with probability $p$ then the model is

$$p(x) = \frac{1}{1+e^{-(a+bx)}}$$

There is a linear part $a+b x$, but we do not 'make the regression linear'.

Or at least, we do not make the regression linear in the sense of transforming the outcomes and solving it as a linear equation. This is for instance done by Microsoft's Excel when it fits an exponential curve by transforming the observed $y$ and solves it with a single linear regression. Below is an example of the difference between the linearized fit and a non-linear fit. The linearized fit is optimizing the errors in the right graph.
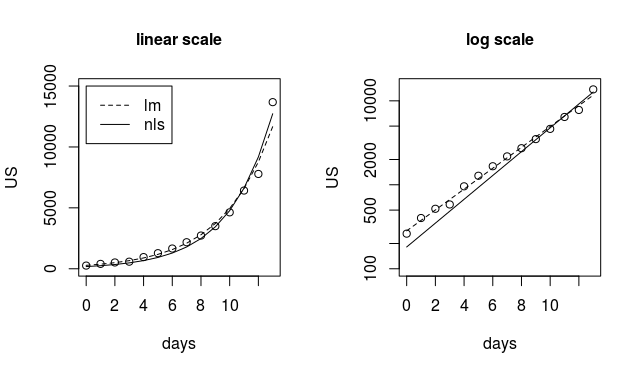
example

Linearization in generalized linear models

To be fair, In logistic regression, a special case of a generalized linear model, there is some form of linearization in another sense.

What is that form and why is that done?

To get to the solution of the non-linear problem an algorithm is used that approaches the solution iteratively and in each step it solves a 'linearized' form of the equations.

The reason to linearize is because it creates a simple way to find a solution. Below we see this illustrated in an image related to gradient descent (from here). The optimization of the non-linear function is done in steps and the solution is found by following the gradient of the cost function, which gives a linear function instead of a non-linear function. The solution of that linearized function takes us into the direction of the arrow, and by following multiple steps we follow along the path getting closer to the final solution.
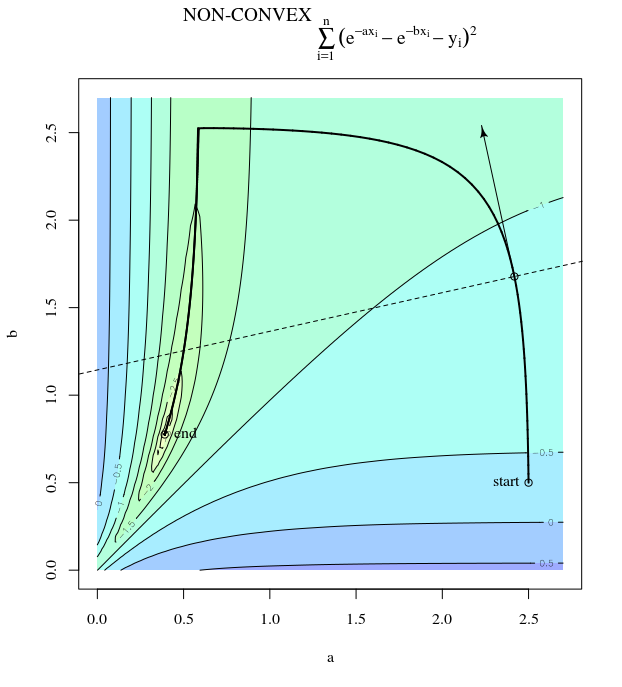
non convex

$\endgroup$
4
  • $\begingroup$ +1 always enjoy reading your answer! $\endgroup$
    – Haitao Du
    Commented Nov 3, 2021 at 10:39
  • $\begingroup$ It is useful to know this as this is the “engine” of the method. Is there practical use for the iterations needed for convergence? So for example the Stata glm command with logistic regression option shows for each iteration the log likelihood. Presumably this information is useful, perhaps when comparing two different models faster convergence (fewer iterations) or higher log-likelihood is better. Rephrased, how could this output be used? $\endgroup$ Commented Nov 3, 2021 at 12:22
  • $\begingroup$ @SingleMalt my plan is to redo that last graph (which I took from another question) for the case of logistic regression. Maybe that would clarify it better. $\endgroup$ Commented Nov 3, 2021 at 12:26
  • $\begingroup$ In an answer in the following link, the Stata logistic regression includes “Iteration 6: log likelihood = -17.161893”. Is this information useful in any way doing model building or perhaps even inference? stats.stackexchange.com/questions/144960/… // For logistic regression is it usually convex or not? I thought (possibly wrongly!) that apart from with severe multicollinearity it usually always converges, and so I assumed logistic regression is a convex problem. $\endgroup$ Commented Nov 3, 2021 at 19:44
2
$\begingroup$

Logistic regression is a generalized linear model. Generalized linear models are rather simple, easily explainable, linear in parameters models that generalize the idea behind linear regression. While linear regression predicts

$$ E[y|X] = \mathbf{X}\boldsymbol{\beta} $$

generalized linear models predict

$$ E[y|X] = g^{-1}\Big( \mathbf{X}\boldsymbol{\beta} \Big) $$

where $g^{-1}$ is an inverse of a link function "provides the relationship between the linear predictor and the mean of the distribution function". In case of logistic regression, the mean of Bernoulli distribution is probability, so it is bounded between zero and one. Logistic function is one of the links that maps the linear predictors to the interval (you can use also other links, for example probit, complementary log-log, or other). If likelihood is another distribution, the link would differ, for example, with Gaussian the link is an identify function (no link), for Poisson you could use log link because it needs to be non-negative, etc. The documentation of the family method in R summarizes the possible choices:

The gaussian family accepts the links (as names) identity, log and inverse; the binomial family the links logit, probit, cauchit, (corresponding to logistic, normal and Cauchy CDFs respectively) log and cloglog (complementary log-log); the Gamma family the links inverse, identity and log; the poisson family the links log, identity, and sqrt; and the inverse.gaussian family the links 1/mu^2, inverse, identity and log.

If you didn't use the link function for logistic regression, you would be predicting the probabilities that are below zero or above one, they wouldn't be valid.

$\endgroup$
2
  • $\begingroup$ Did not realise there was a cauchit option. Is cauchit an option if you still want symmetry between high and low probabilities, and the chance of high and low probabilities is higher than provided by logit? Or because the Cauchy distribution has an undefined kurtosis, does it offer something different than logit? $\endgroup$ Commented Nov 3, 2021 at 12:31
  • $\begingroup$ @SingleMalt it's just a link function, don't confuse it with the distribution rdocumentation.org/packages/VGAM/versions/1.1-5/topics/… $\endgroup$
    – Tim
    Commented Nov 3, 2021 at 13:56

Your Answer

By clicking “Post Your Answer”, you agree to our terms of service and acknowledge you have read our privacy policy.

Not the answer you're looking for? Browse other questions tagged or ask your own question.