0
$\begingroup$

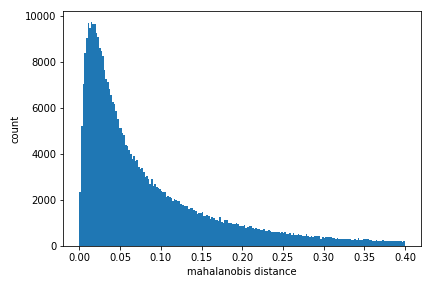
I'm starting a research on Multi-Object-Tracking, the current state-of-the-art real-time methods have a detector that outputs a bounding_box and an embedding vector: $$ e \in \mathbb{R}^n $$ When a new target is found the embedding is saved and a new Kalman filter is created and together they form a tracker . Each frame the the detections and the trackers are matched in the following manner: the embedding distance (i.e. cosine distance) and the Mahalanobis distance(Kalman to bounding box) are measured between all the trackers and detections. the distances are merged using a simple blending: $$d = \lambda e + (1- \lambda) m ; \lambda \in [0,1] $$ what I'm trying to investigate is to what is the proper representation of these two distances (if I can do any thing to improve their performance). what I reached so far is that there is some correlation between these values: $$ \rho_{x,y} = \frac{E[ (x - \mu_x) (y - \mu_y)^T]} {(\sigma_x \sigma_y)} = 0.23$$ the histograms:
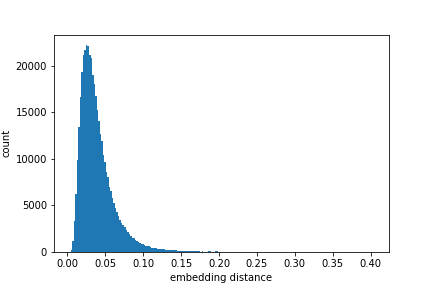
embedding distance histograms

mahalanobis distance

How should I approach this problem?

$\endgroup$

1 Answer 1

0
$\begingroup$

Based on your title and the two histograms, a simple bivariate scatter plot, histogram, etc. would be useful without any fancy modeling. The marginal distributions look like a log-normal, gamma, or other familiar skewed distribution. You don't necessarily need to fully specify the joint distribution to account for the correlation between the marginal endpoints. You could use generalized estimating equations to model the means and variances using the mean-variance relationship of, say, a log-normal distribution while accounting for the correlation between observations using either a model-based correlation structure or an empirical sandwich covariance estimate. You could use the resulting parameter estimates and their standard errors to perform inference on other aspects of the marginal distributions, like percentiles, by fully specifying lognormal marginal distributions. If you ultimately end up just focusing on describing and inferring the aspects of the marginal endpoints, ignoring the correlation is not so awful. The resulting estimation and inference is still valid, it is just not as efficient.

Let me know if I have addressed your question or if you had something else in mind.

$\endgroup$

Your Answer

By clicking “Post Your Answer”, you agree to our terms of service and acknowledge you have read our privacy policy.

Not the answer you're looking for? Browse other questions tagged or ask your own question.