1
$\begingroup$

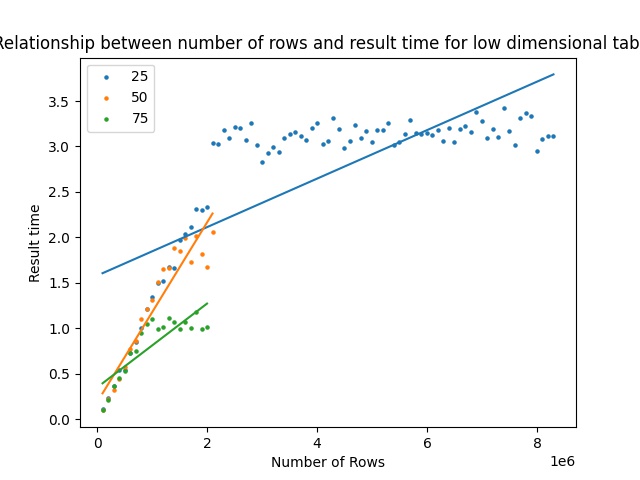
I have data that looks like:

As you can see my linear modeling doesn't really work since the y values increase and then stay constant. I want to separate my data for each group into 2 and then perform linear regression on both but the cutoff point is also unknown. How can I go about modelling such phenomena I have no idea?

$\endgroup$
2
  • $\begingroup$ If you have such a clear pattern (common staircase and three floors), why not base your analysis right on the picture? I.e., separate regression for the floors, plus one for the staircase. $\endgroup$
    – ttnphns
    Commented Dec 4, 2021 at 16:09
  • $\begingroup$ I do not know when these floors occur (i.e. there's no deterministic way of finding the number of rows after which the result time is constant). $\endgroup$ Commented Dec 4, 2021 at 17:28

1 Answer 1

1
$\begingroup$

Try modeling with linear splines where the knots are a part of optimization, so you may need nonlinear regression

$\endgroup$
1
  • $\begingroup$ I'll have a look thanks for the tip. Do you have any recommendations for resources? $\endgroup$ Commented Dec 2, 2021 at 18:38

Your Answer

By clicking “Post Your Answer”, you agree to our terms of service and acknowledge you have read our privacy policy.

Not the answer you're looking for? Browse other questions tagged or ask your own question.