0
$\begingroup$

I've been having some trouble with this story problem. Any help you could give me would be really appreciated.

A store manager monitors the store's temperature by taking 4 independent temperature readings at 4 locations where, if the system is working correctly, the temp. is normally distributed with a mean of 68 degrees F and a standard deviation of 3 degrees. What's the mean and standard deviation of the average of these 4 readings if the system is working correctly? What upper and lower limits should the manager set for the average of these 4 readings for there to be a .01 probability of violating a limit when the system is working correctly?

Thanks for any advice/help you can give me!

$\endgroup$

1 Answer 1

5
$\begingroup$

The two key elements that you need to be familiar with before working through this exercise are:

  • The sampling distribution of a mean: in your case, the average of your four measurements will follow a normal distribution, with a mean that equals that of the parent distribution but with a standard deviation of $3/\sqrt{4}$.
  • How to translate probabilistic assertions in terms of the underlying Probability Density Function: given that there is an infinite number of possible PDFs for a distribution described by two parameters (its location and shape), it is often more convenient to work with the standardized normal distribution which is simply $\mathcal{N}(0;1)$, because if $X\sim \mathcal{N}(\mu; \sigma)$, then we know that $Z=\frac{X-\mu}{\sigma}\sim\mathcal{N}(0;1)$.

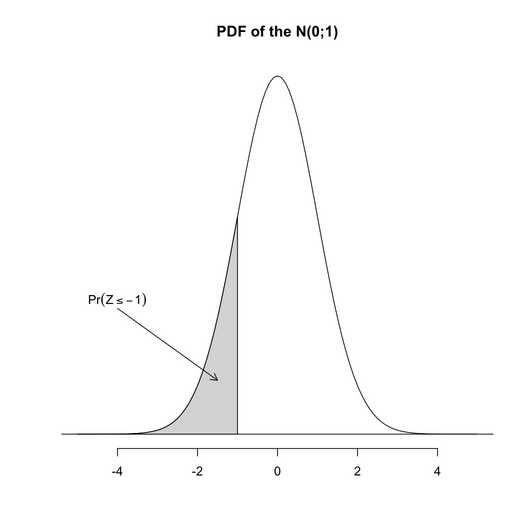
Then, you just have to figure out how to find $z_1$ and $z_2$ such that $\Pr(z_1\leq Z\leq z_2)=1-0.01$. It often helps to draw the graph of $\Pr(Z\leq z)$ which is bell-shaped, centered on its mean, and whose total area equals 1. For instance, for a given quantile $z_1$, $\Pr(Z<z_1)=p_1$ where $p_1$ is the shaded area shown below (here, $z_1=-1$, that is 1 standard deviation below the mean):

alt text

As the total area equals 1, the remaining (unshaded) area equals $1-p_1$. Likewise, you may readily express any bounded area as a sum or difference of such inequalities.

$\endgroup$
3
  • $\begingroup$ So in this particular case, I should calculate a z-score for probabilities of .99 and .01 (i.e. 2.326), then multiply that number by the sampling standard deviation and add or subtract to the mean to get the upper and lower limits? $\endgroup$
    – user2385
    Commented Dec 17, 2010 at 3:28
  • $\begingroup$ @user2385 You got the idea, but don't forget that the 1% are distributed in both tails so that you have to work with .005 ($Z$ will be $<0$, $X$ will be $<68$) and .995 ($Z$ will be $>0$, $X$ will be $>68$), for the total area exceeding the limit equals 1%. No need to substract to the mean, you already know that $X=Z\mu +\sigma$. Just use the correct $\sigma$ to go back from the std normal to the sampling distribution of your empirical mean. $\endgroup$
    – chl
    Commented Dec 17, 2010 at 10:48
  • $\begingroup$ Ah I see. Thanks for all the help, I really appreciate it! $\endgroup$
    – user2385
    Commented Dec 17, 2010 at 23:31

Your Answer

By clicking “Post Your Answer”, you agree to our terms of service and acknowledge you have read our privacy policy.

Not the answer you're looking for? Browse other questions tagged or ask your own question.