5
$\begingroup$

I am afraid I am asking a stupid question... but...

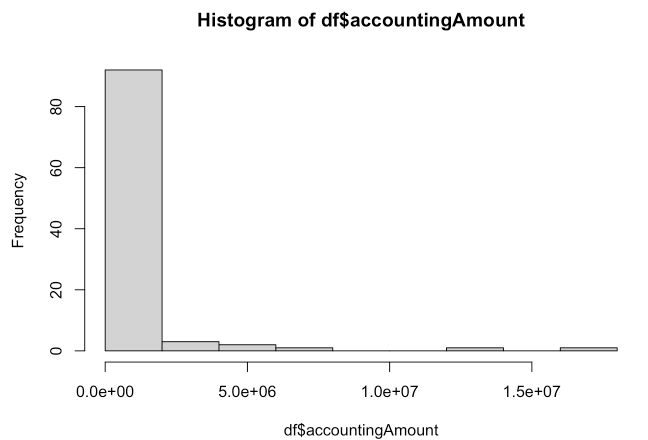
I would like to study the spending (my outcome variable) of a company by department, number of staff, activity, etc. I have collected my data and when I plot the spending, it looks very skewed:

enter image description here

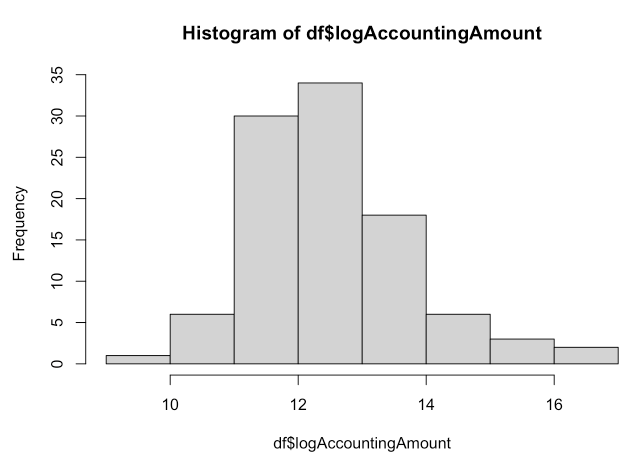
So, I thought it was a good candidate for log-transformation:

enter image description here

which looks more normal.

Then, I ran a linear regression:

lm(log(accountingAmount) ~ Pred1 + Pred2 + Pred3, data=df)

I was thinking of running a GLM Poisson regression but my outcome is not really count (well... I guess it could be considered as count since it is dollars) and its variance is far from being equal to the mean, which does not meet the criteria for Poisson distribution.

I have read different posts (log-linear vs Poisson, Is log-linear a GLM or Poisson regression vs log-linear model), but I could not really find my answer.

Questions

So, is my first approach (using lm(log(accountingAmount) ~ Pred1 + Pred2 + Pred3, data=df)) a good approach? Basically, it is the "standard way" to do log-linear regression?

Is that correct that GLM Poisson regression is not possible in this case (because of very high variance compared to the mean) ?

$\endgroup$
4
  • 3
    $\begingroup$ Poisson regression is for counts. A more suitable GLM might perhaps be a Gamma with log-link. $\endgroup$
    – Glen_b
    Commented Dec 12, 2021 at 22:41
  • $\begingroup$ Thank you @Glen_b! I just did it and actually the results are very similar to the ones I got with my first approach. In this situation, are there any reasons why I should favor more one model than the other? $\endgroup$
    – Mat
    Commented Dec 13, 2021 at 6:36
  • 1
    $\begingroup$ If you expect larger uncertainty for higher amounts (which seems very reasonable in accounting), your approach is very suitable. Of course, you need to consider that you are assuming an exponential relationship on the original scale. $\endgroup$
    – Roland
    Commented Dec 13, 2021 at 7:54
  • $\begingroup$ Thanks @Roland, this is very helpful! $\endgroup$
    – Mat
    Commented Dec 13, 2021 at 8:01

2 Answers 2

7
$\begingroup$

The term "log-linear" isn't uniquely defined. Even Wikipedia doesn't seem to come to internal agreement. Its entry on log-linear analysis has to do with modeling counts in contingency tables, while its log-linear model entry describes your approach to modeling. I try to avoid that terminology and just say what's being modeled. In your case, it's ordinary linear regression with a log-transformed outcome.

There's nothing wrong with log transformation of a continuous, strictly positive outcome. If the residuals from your resulting linear regression model are well behaved, it's probably the simplest way to go. A drawback is that you are modeling mean values on the log scale, which isn't how people typically think about means.

You are correct that a Poisson GLM isn't appropriate for continuous non-count data, but other types of GLM can use a log link and might work for your data. This page suggests other GLM approaches, like Gaussian (possibly inverse) or gamma with log links, which might work better and more readily give predictions on an untransformed mean scale.

$\endgroup$
0
4
$\begingroup$

Let $y$ be your outcome (accounting amount) and let $x_1, x_2, x_3$ be your three predictors (for one individual). Then your approach is modeling $$\log y = \beta_0 + \beta_1 x_1 + \beta_2 x_2 + \beta_3 x_3 + \varepsilon$$ Taking the exponential of both sides gives $$y = \exp \left( \beta_0 + \beta_1 x_1 + \beta_2 x_2 + \beta_3 x_3 + \varepsilon \right)$$ The mean of $y$ conditional on $x_1$, $x_2$ and $x_3$ is $$E(y | x_1, x_2, x_3) = \exp \left( \beta_0 + \beta_1 x_1 + \beta_2 x_2 + \beta_3 x_3\right) E(\exp (\varepsilon ) )$$ Now imagine that $x_1$ is replaced with $x_1 + 1$. Then $$E(y | x_1 + 1 , x_2, x_3) = \exp(\beta_1) E(y | x_1, x_2, x_3)$$ In other words, a unit change in the predictor changes the mean by a multiplicative factor.

The point is that the log transform, while better in terms of ensuring normality of residuals, changes the interpretation of the model coefficients. To directly answer your question, it is a perfectly acceptable approach but you should think about what you really want to model.

For the second question: there are several extensions to a Poisson GLM that account for overdispersed data (where the conditional variance is greater than the conditional mean). For example, you could use a negative binomial GLM (glm.nb) in R or a quasi-likelihood approach

$\endgroup$

Your Answer

By clicking “Post Your Answer”, you agree to our terms of service and acknowledge you have read our privacy policy.

Not the answer you're looking for? Browse other questions tagged or ask your own question.