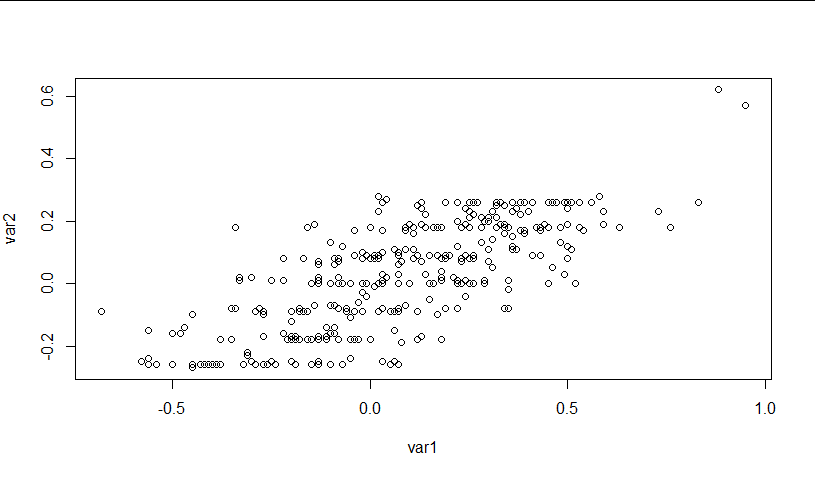
I have a data set in which two variables are collinear (r^2 ≈ 0.7). I decided to extract the principal components, and then include these in a regression analysis to see which of the two variables seemed to be more important.
When I run pca<-prcomp(dataset[var1, var2], scale=TRUE), and then view the factor loadings I get using the pca command, the output is:
Standard deviations (1, .., p=2):
[1] 1.3199080 0.5077823

Rotation (n x k) = (2 x 2):
            PC1        PC2
var1 -0.7071068  0.7071068
var2 -0.7071068 -0.7071068
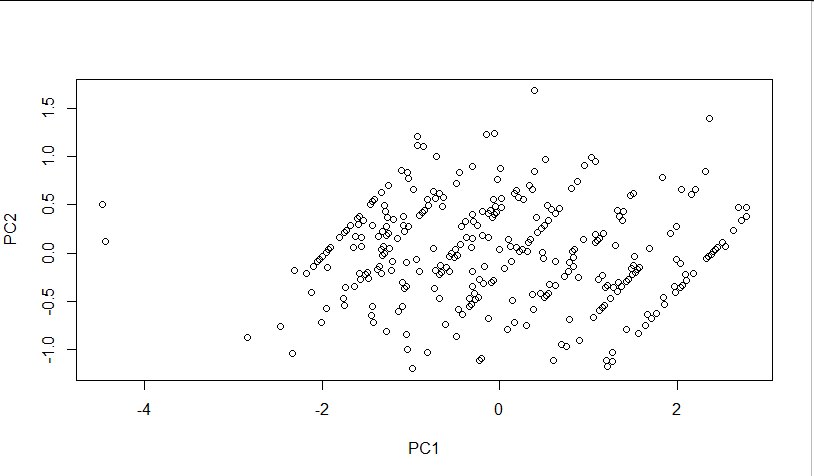
I know this isn't normal, but I'm really confused about what this is telling me about my data. Why are the loadings identical? I can't say anything about which variable is more important now, by the looks of things? When regressed, the first component is a highly significant predictor of the response variable whilst the second is not.
The raw data is shown in Figure 1, and plotted on these PCAs in Figure 2. I'd be grateful for any insight anyone could give.


