1
$\begingroup$

On fitting a simple linear regression to some data, we get the following residual plot. enter image description here
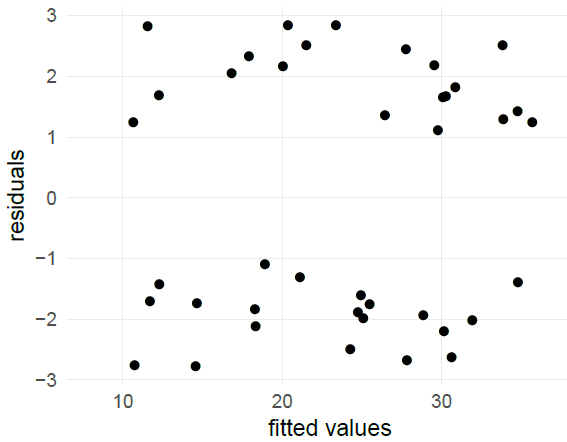
Can we say from the inspection of this plot that the normality assumption is violated? What mechanism could have resulted in a plot of this form?

$\endgroup$
4
  • 1
    $\begingroup$ Although -- with good reason -- this plot is often recommended, I find that people who struggle with it may be helped by also looking at a plot of observed versus fitted. It's the same information but may help to see what is going on. Here two clusters will be either side of the reference line observed $=$ fitted. $\endgroup$
    – Nick Cox
    Commented Jan 30, 2022 at 11:15
  • $\begingroup$ Is this real data? I am wondering if it was invented to make a point. What are the variables and what was your source? $\endgroup$
    – Nick Cox
    Commented Jan 30, 2022 at 11:39
  • 2
    $\begingroup$ @Nick Real-world data can look like this: it's a (clear) indication of the presence of a latent binary variable that is strongly associated with the response. $\endgroup$
    – whuber
    Commented Jan 30, 2022 at 15:49
  • $\begingroup$ I agree that such data are entirely possible: it's just that the example is so blatant. There seem to be 20 points on each side too.... $\endgroup$
    – Nick Cox
    Commented Jan 30, 2022 at 17:16

1 Answer 1

3
$\begingroup$

The residuals as you've plotted them are certainly not normal because they appear to be bimodal.

One possible explanation is that you have omitted a variable in your regression which has an additive effect on the conditional mean. Let $z$ be a binary indicator for some class membership. It appears that the true data generating process may look like

$$ y = \beta_0 + \beta_1 x + \beta_2z $$

But you've only fit a model with $x$ and not $z$. I can recreate your plot by simulating this scenario quite easily

set.seed(1992)
N = 50
x = rnorm(N)
z = rbinom(N, 1, 0.5)
y = x + 2*z + rnorm(N, 0, 0.1)
model = lm(y~x)


plot(fitted(model), resid(model))

enter image description here

Have you omited a variable in your regression? If not, you may find techniques described in this thread interesting.

$\endgroup$
2
  • $\begingroup$ Quite insightful! But it seems that I have taken all variables into account in my regression analysis. Is there any other model which can lead to such a residual plot? $\endgroup$ Commented Jan 30, 2022 at 3:37
  • 3
    $\begingroup$ @MathsFreak There might be some variable which was not recorded that is leading to this. I recommend you use methods in this thread stats.stackexchange.com/questions/389545/… $\endgroup$ Commented Jan 30, 2022 at 3:43

Your Answer

By clicking “Post Your Answer”, you agree to our terms of service and acknowledge you have read our privacy policy.

Not the answer you're looking for? Browse other questions tagged or ask your own question.