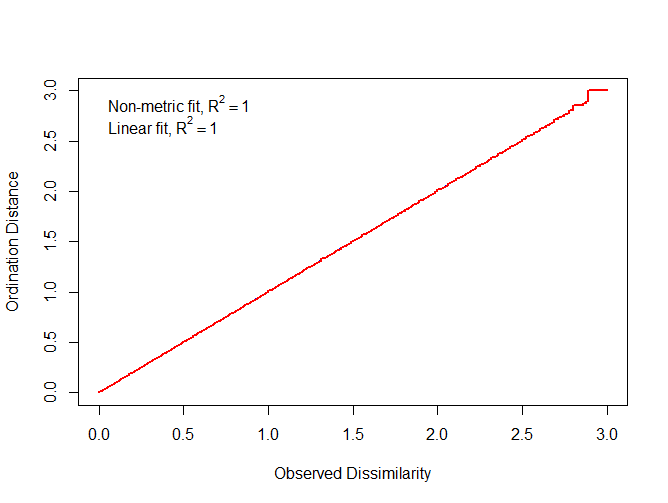
I'm doing a non-metric multidimensional scaling analysis. The analysis results in two convergent solutions and the output all look good, but when I made a stress plot to check the data I am getting an r-squared of 1 which I've never seen before and can't find any guidance in the literature of what this means. The stress plot figure will not be included as a part of the final manuscript, and otherwise the outputs and ordiplot look good. Has anyone encountered this before or know what this could mean? I'll include the code and subsequent figure below.
nmds.participant <- metaMDS(impact_dist, distance = "euclidian",
          k = 2, trymax = 50, autotransform = FALSE)
nmds.participant
# Call:
# metaMDS(comm = impact_dist, distance = "euclidian", k = 2,
          trymax = 50, autotransform = FALSE)
#
# global Multidimensional Scaling using monoMDS
#
# Data:     impact_dist
# Distance: user supplied
#
# Dimensions: 2
# Stress:     7.216141e-16
# Stress type 1, weak ties
# Two convergent solutions found after 20 tries
# Scaling: centring, PC rotation
# Species: scores missing

