0
$\begingroup$

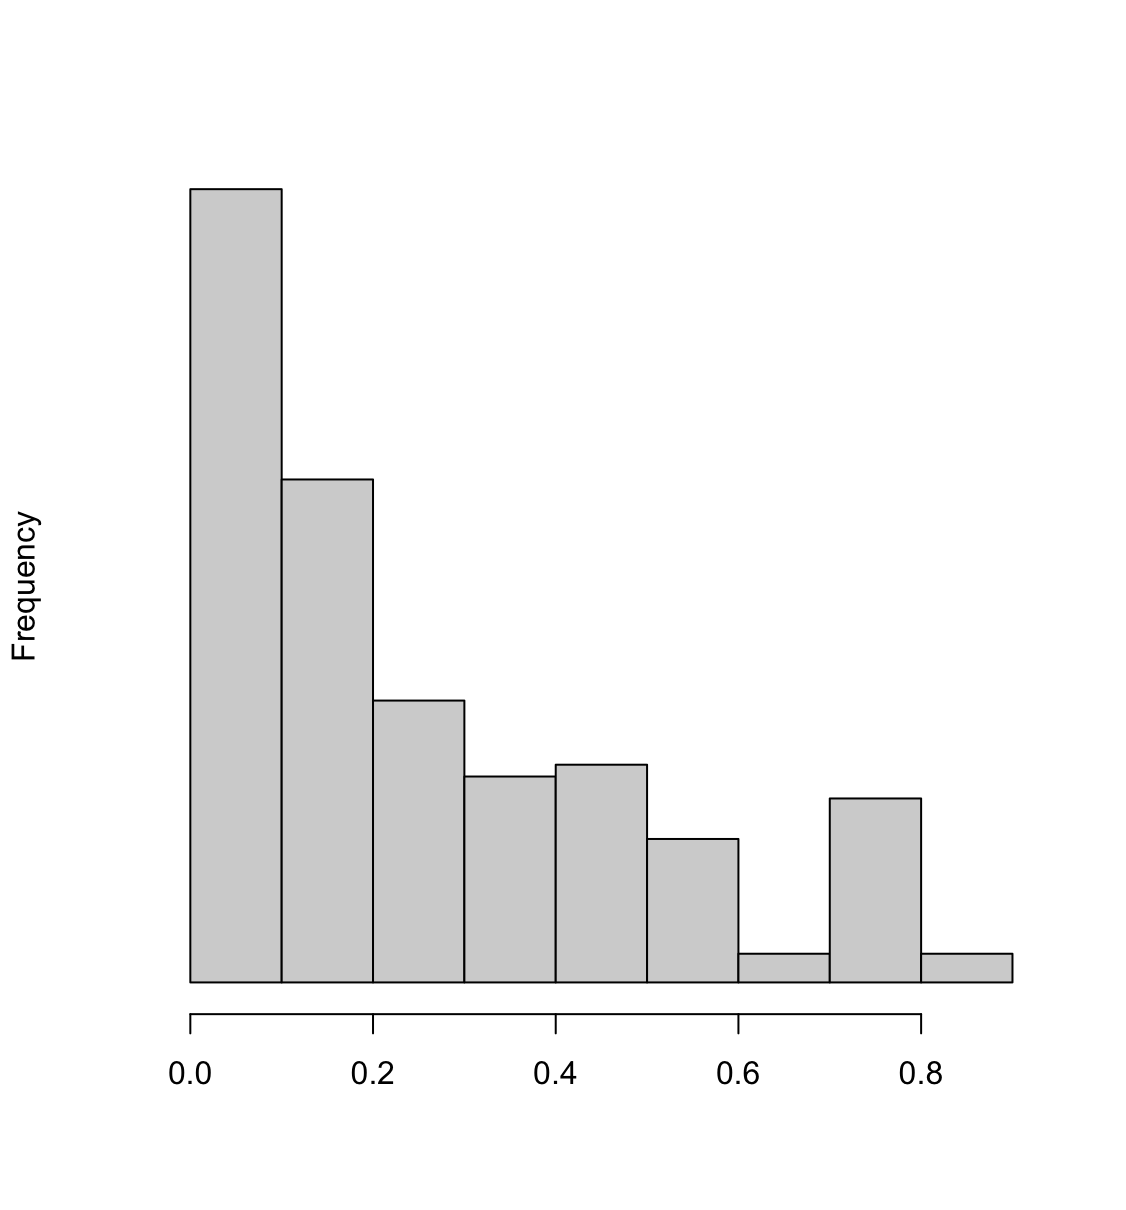
I'm using GAM to model a potentially non-linear relationship between two variables (with some controls variables included) in mgcv. My main independent variable is a proportion (without 0's or 1's) that is highly skewed (see image 1 histogram).

  1. Is there justification/reasoning to make an IV normal in GAM?
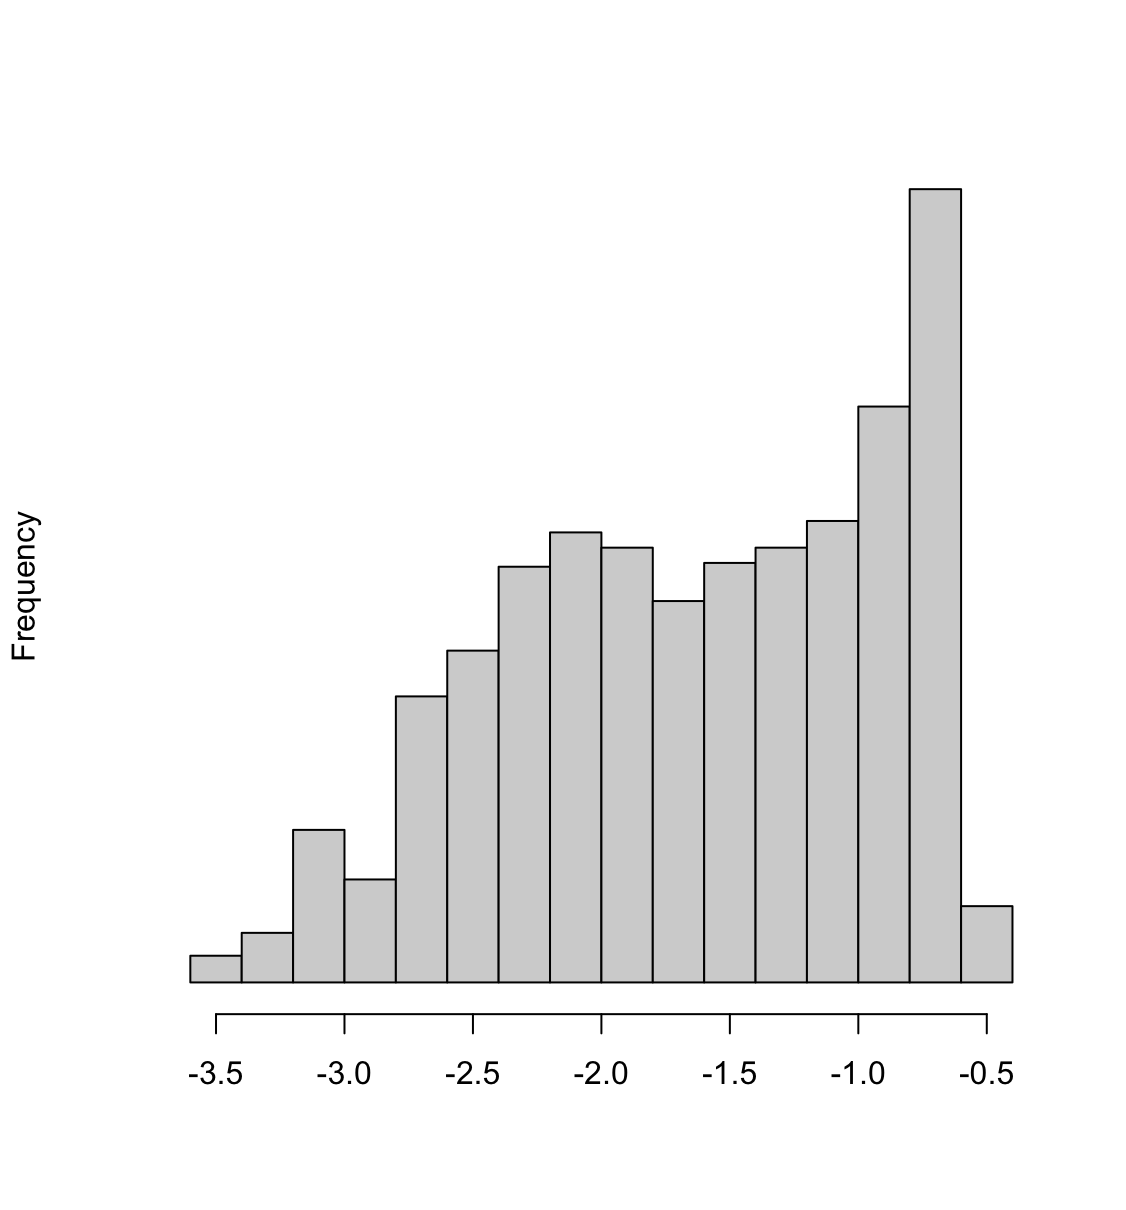
  2. Should I transform this variable? I tried to sqrt(IV) (see image 2) and log10((IV)/(1-IV)) (see image 3). Functional form of results are different but not drastically depending on which (or none) transformation is used.

r code:

gam(DV ~ s(IV) + CV1 + CV2 +
                   s(CASEID, bs="re"), data = df, method = "REML")

Histograms of IV:

untransformed IV
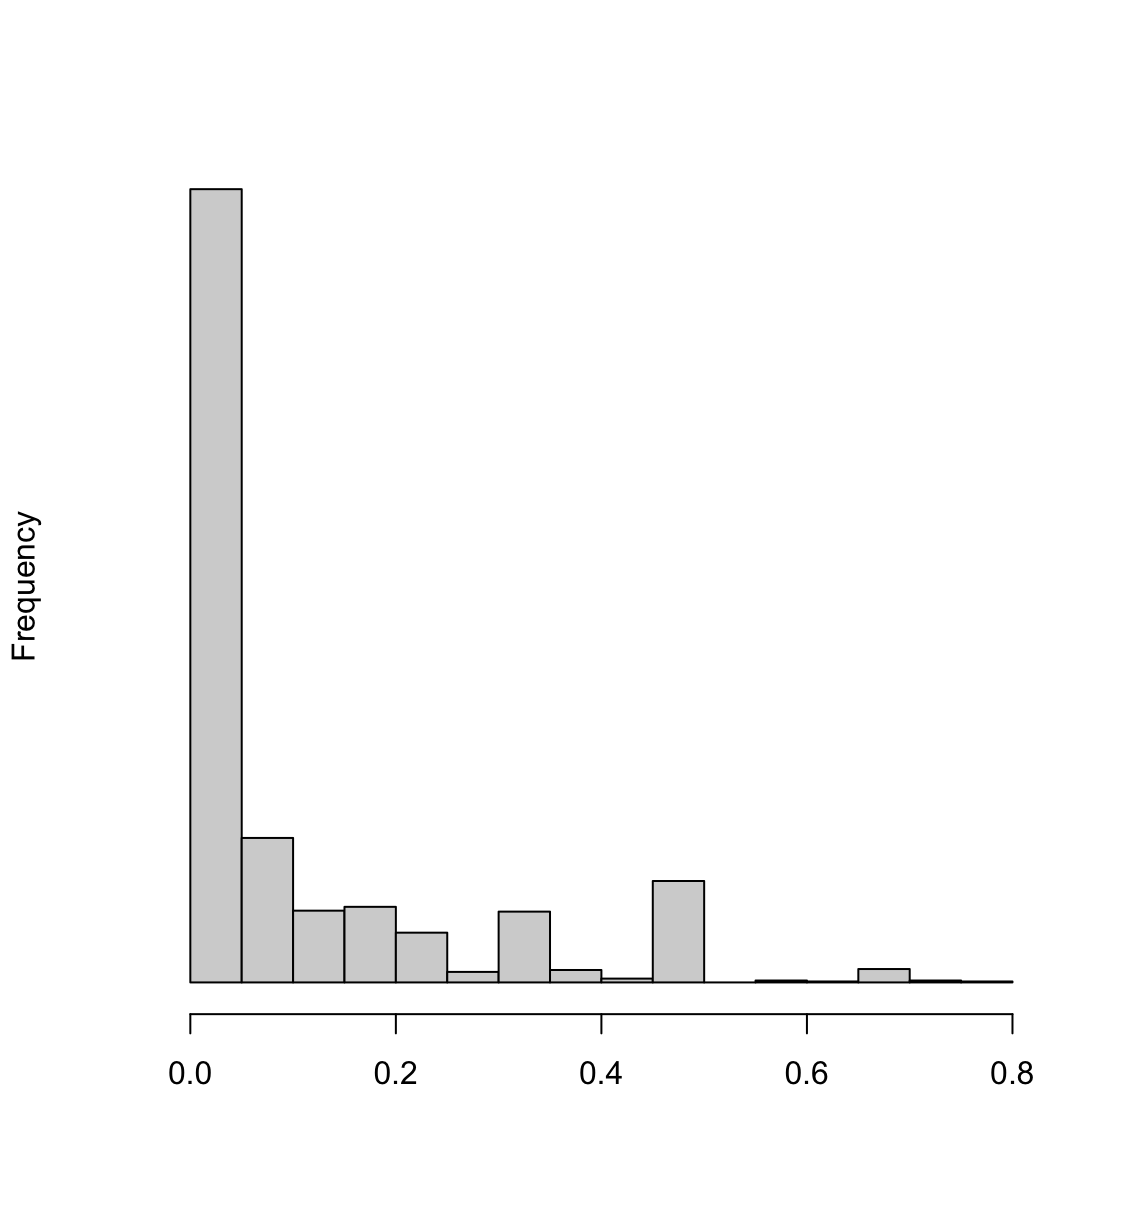
image 1 - untransformed IV

sqrt(IV)

image 2 - sqrt IV

log10(IV)/(1-IV)

image 3 - log10(IV)/(1-IV)

$\endgroup$
1
  • $\begingroup$ Thank you! That makes sense. If I were to want to transform the variable, is there justification for that position? As stated, the results are generally the same, but cleaner (less chaotic wiggliness) in the transformed IV analyses. $\endgroup$
    – saltik
    Commented Feb 21, 2022 at 20:23

2 Answers 2

1
$\begingroup$

GAMs make no assumptions at all about the independent (predictor) variables (except, for some types of inference, that they are measured without error); certainly there are no assumptions about the distribution of the predictors, which are taken as observed values rather than as random variables.

Although the flexibility of GAMs can in principle handle most of the the issues that transforming the data would alleviate in a 'vanilla' linear model (i.e. nonlinearity in the response), I can imagine that using a transformation to stretch out part of the predictor space could improve the performance of the model under some circumstances.

  • you should have a clear idea what your metric is for model improvement (you say the result is 'cleaner'; do you have an objective way of quantifying that, or are you OK with using subjective assessments to guide your modeling?).
  • if you are worried about overfitting, be aware that trying a bunch of different transformations could be a form of 'data snooping'
$\endgroup$
2
  • $\begingroup$ Transforming does improve fit, as Robert has suggested. Constraining the basis function to be the same across the models produces the same functional form but with varying confidence intervals (much wider for untransformed). Thank you Bolker and Robert for your helpful responses. $\endgroup$
    – saltik
    Commented Feb 24, 2022 at 20:26
  • $\begingroup$ If one or both of these questions solved your problem, you should pick one (whichever you thought was most useful) and click the check-mark to accept it ... $\endgroup$
    – Ben Bolker
    Commented Feb 24, 2022 at 20:27
1
$\begingroup$

The third plot should be log10(IV/(1-IV)), not log10(IV) /(1-IV).

Often transforming an IV to a more "normal" distribution gives a better fit to the response variable. You could see which of the 3 transforms gives the best fit according to a criterion, e.g the generalised Akaike information criterion (GAIC), which includes AIC and BIC as special cases.

$\endgroup$

Your Answer

By clicking “Post Your Answer”, you agree to our terms of service and acknowledge you have read our privacy policy.

Not the answer you're looking for? Browse other questions tagged or ask your own question.