9
$\begingroup$

For a 2 by 2 contingency table, some said Fisher's exact test uses the count $X_{1,1}$ in the (1,1) cell in the table as the test statistic, and under null hypothesis, $X_{1,1}$ will have a hypergeometric distribution.

Some said its test statistic is $$ |X_{1,1} - \mu| $$ where $\mu$ is the mean of the hypergeometric distribution (mentioned above) under null. It also said that p-values is determined based on the tabel of hypergometric distribution. I was wondering if there is some reason to subtract mean and then to take absolute value? $|X_{1,1} - \mu|$ doesn't have a hypergeometric distribution under null, does it?

$\endgroup$

3 Answers 3

10
$\begingroup$

(To make our notions a little more precise, let's call the 'test statistic' the distribution of the thing we look up to actually compute the p-value. This means that for a two-tailed t-test, our test statistic would be $|T|$ rather than $T$.)

What a test statistic does is induce an ordering on the sample space (or more strictly, a partial ordering), so that you can identify the extreme cases (the ones most consistent with the alternative).

In the case of Fisher's exact test, there's already an ordering in a sense - which are the probabilities of the various 2x2 tables themselves. As it happens, they correspond to the ordering on $X_{1,1}$ in the sense that either the largest or smallest values of $X_{1,1}$ are 'extreme' and they are also the ones with smallest probability. So rather than look at the values of $X_{1,1}$ in the way you suggest, one can simply work in from the large and small ends, at each step just adding whichever value (the largest or smallest $X_{1,1}$-value not already in there) has the smallest probability associated with it, continuing until you reach your observed table; on its inclusion, the total probability of all those extreme tables is the p-value.

Here's an example:
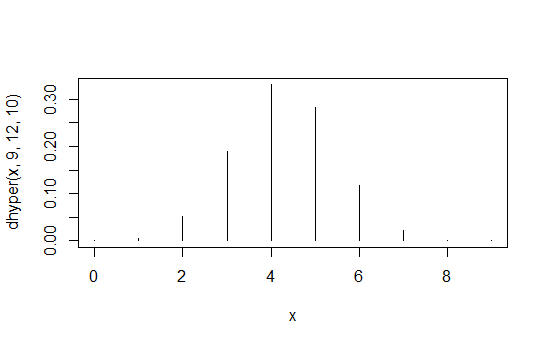
hypergeometric probability function

> data.frame(x=x,prob=dhyper(x,9,12,10),rank=rank(dhyper(x,9,12,10)))
   x         prob rank
1  0 1.871194e-04    2
2  1 5.613581e-03    4
3  2 5.052223e-02    6
4  3 1.886163e-01    8
5  4 3.300786e-01   10
6  5 2.829245e-01    9
7  6 1.178852e-01    7
8  7 2.245433e-02    5
9  8 1.684074e-03    3
10 9 3.402171e-05    1

The first column are $X_{1,1}$ values, the second column are the probabilities and the third column is the induced ordering.

So in the particular case of the Fisher exact test, the probability of each table (equivalently, of each $X_{1,1}$ value) can be considered the actual test statistic.

If you compare your suggested test statistic $|X_{1,1}-\mu|$, it induces the same ordering in this case (and I believe it does so in general but I have not checked), in that larger values of that statistic are the smaller values of the probability, so it could equally be considered 'the statistic' - but so could many other quantities -- indeed any that preserve this ordering of the $X_{1,1}$s in all cases are equivalent test statistics, because they always produce identical p-values.

Also note that with the more precise notion of 'test statistic' introduced at the start, none of the possible test statistics for this problem actually has a hypergeometric distribution; $X_{1,1}$ does, but it's not actually a suitable test statistic for the two tailed test (if we did a one-sided test where only more association in the main diagonal and not in the second diagonal was regarded as consistent with the alternative, then it would be a test statistic). This is just the same one-tailed/two-tailed issue I began with.

[Edit: some programs do present a test statistic for the Fisher test; I'd presume this would be a -2logL type calculation that would be asymptotically comparable with a chi-square. Some may also present the odds-ratio or its log but that's not quite equivalent.]

$\endgroup$
2
  • $\begingroup$ THanks, Glen_b! the distribution of $X_{1,1}$ under null is the hypergeometric distribution, which is not symmetric around its mean $\mu$. So I was wondering if $|X_{1,1} - \mu|$ is a reasonable test statistic? $\endgroup$
    – Tim
    Commented Apr 26, 2013 at 16:10
  • $\begingroup$ It seems an eminently reasonable test statistic, since it's completely interpretable and readily understood. Indeed none of the possible statistics will have a symmetric distribution. Let's forget the specifics of the Fisher test for a moment - if that statistic is meaningful for you, you can calculate an exact test on that basis (using hypergeometric calculations to find the probabilities). If you want to show that they're inducing the same ordering in all cases, that's probably a new question. $\endgroup$
    – Glen_b
    Commented Apr 27, 2013 at 1:29
6
$\begingroup$

$|X_{1,1} - \mu|$ cannot have a hypergeometric distribution in general because $\mu$ does not need to be an integer value and then $|X_{1,1} - \mu|$ would not be an integer. But conditionally on the margins, $X_{1,1}$ will have a hypergeometric distribution.

If you do it properly and fix the margins to known values, you can consider $X_{1,1}$ (or any other cell) to be your statistic. With the analogy of drawing $k$ balls from an urn containing $W$ white balls and $B$ black balls without replacement, $X_{1,1}$ can be interpreted as the number of white balls drawn, where $B$ is the sum of the first row, $W$ is the sum of the second row, $k$ is the sum of the first column.

$\endgroup$
3
$\begingroup$

It doesn't really have one. Test statistics are a historical anomaly - the only reason we have a test statistic is to get to a p-value. Fisher's exact test jumps past a test statistic and goes straight to a p-value.

$\endgroup$
4
  • $\begingroup$ Thank, but is there really not a test statistic? How do you determine the p value then? $\endgroup$
    – Tim
    Commented Apr 21, 2013 at 18:26
  • $\begingroup$ The result of Fisher's exact test is the p-value. $\endgroup$ Commented Apr 22, 2013 at 17:09
  • $\begingroup$ @JeremyMiles: Do you mean test statistics are historical anomalies in that prior to low-cost computing, users calculated Z, t and so on and then compared this test statistic to the pre-calculated tables to determine statistical significance, and as a result, many current users of inferential statistics still think in terms of test statistics when they could just as easily provide a p-value? In other words, is this a sort of generational effect? $\endgroup$
    – rabidotter
    Commented Apr 28, 2013 at 1:51
  • 1
    $\begingroup$ @rabidotter - yes, I guess I do. You see people who write "F = 14.352, df = 2, 568, p < 0.05". Pretty much the only reason anyone cares about F is to calculate P, yet they give F to massive precision, and p to very little precision. $\endgroup$ Commented Mar 31, 2014 at 3:40

Your Answer

By clicking “Post Your Answer”, you agree to our terms of service and acknowledge you have read our privacy policy.

Not the answer you're looking for? Browse other questions tagged or ask your own question.