1
$\begingroup$

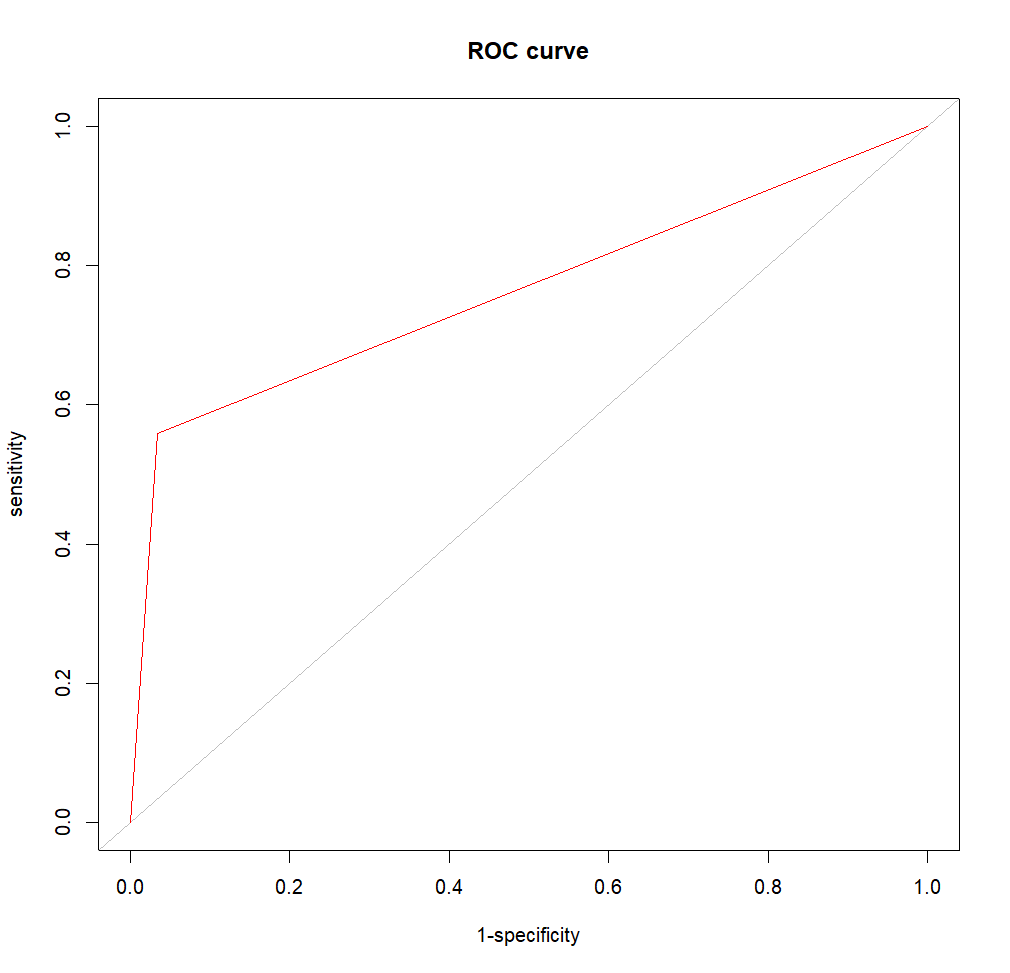
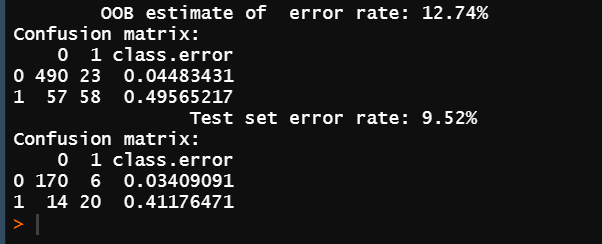
I was working on a random forest model in R and I got a ROC curve that looks like this. This is very odd since there is no curvature. The data does have mostly qualitative features with only 2-3 quantitative features. The data is also mostly one class (i.e. 80% of my data is in one class and 20% in the second class). It seems to favor sensitivity over specificity. The other issue is that the performance says that it only has 3 data points. I have a lot of data so I am not sure why it says only 3 points. Could someone explain what is happening with this ROC curve and why there is no curvature?

This is my code for the ROC curve plot.

#Test
pred <- ROCR::prediction(as.numeric(predict(forest.out, newdata = 
x_test, type =  "response")), labels = as.numeric(y_test$Success))
perf <- performance(pred, measure = "tpr", x.measure = "for")

#Plot
plot(perf, xlab = "1-specificity", ylab = "sensitivity", main = "ROC 
curve")
abline(0,1, col = "grey")
plot(perf, add = TRUE, col = "red")

enter image description hereenter image description here

enter image description here

$\endgroup$
4
  • $\begingroup$ Did you plot predicted probabilities or predicted classes? $\endgroup$
    – Sycorax
    Commented Mar 26, 2022 at 4:34
  • $\begingroup$ Make sure your model is not predicting all data points to be the larger class. $\endgroup$
    – wzbillings
    Commented Mar 26, 2022 at 4:43
  • $\begingroup$ The predictions were across both classes. @Sycorax I am not actually sure if it is probabilities and predicted classes. I'll add more code to my question. $\endgroup$
    – Jason
    Commented Mar 26, 2022 at 16:19
  • $\begingroup$ Related or possibly duplicate: stats.stackexchange.com/questions/562816/… $\endgroup$ Commented Mar 26, 2022 at 16:39

2 Answers 2

1
$\begingroup$

If you read the documentation for random forest’s predict, you’ll see that type="response" gives class labels. If you change the type, you can get probabilities (or votes), which will likely give a more typical ROC shape (many stair steps instead of 2 lines).

$\endgroup$
1
  • $\begingroup$ It gives me an error if I use type ="prob" and when I use type="class", nothing changes. It seems like a good suggestion but it's not working for me. $\endgroup$
    – Jason
    Commented Mar 28, 2022 at 23:03
0
$\begingroup$

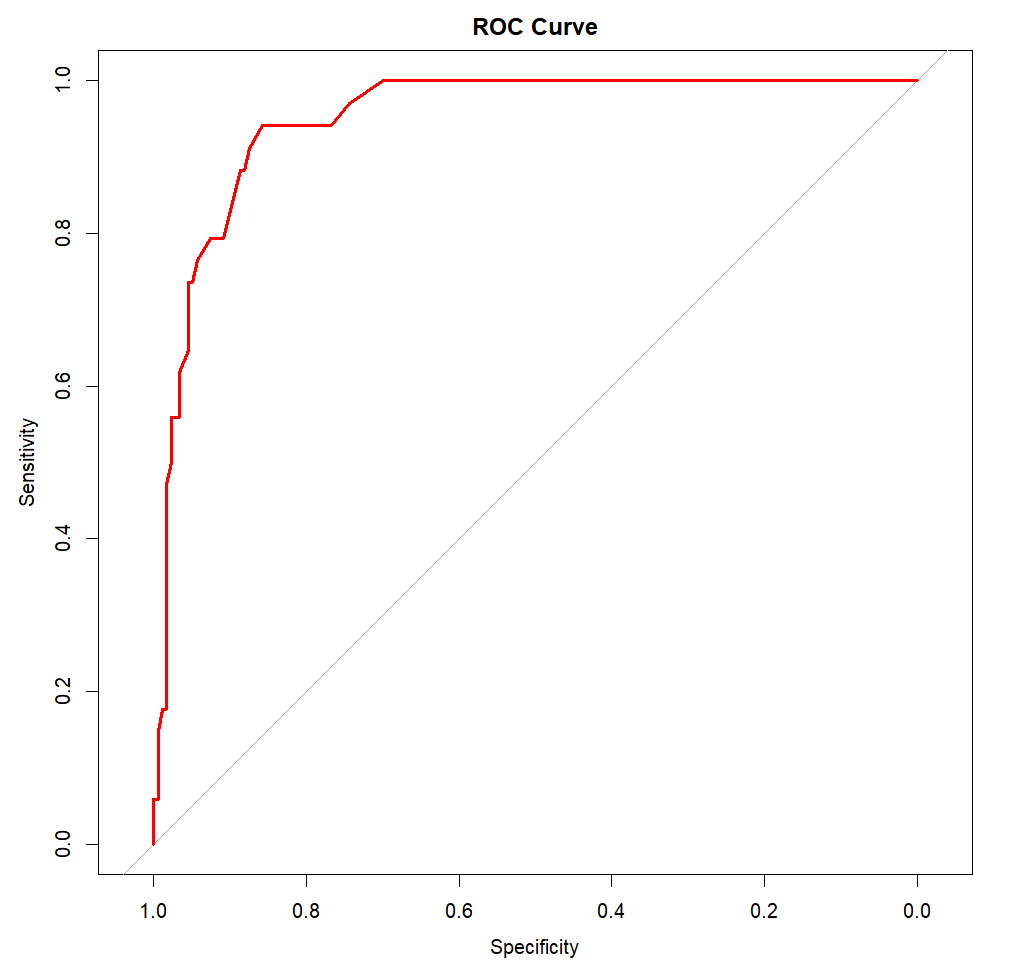
I was able to plot the ROC curve by a different method. I have the code below. I am still not sure why the code I had previously would not work.

library(pROC)
rf.roc<-roc(y_test$Success, forest.out$test$votes[,2])
plot(rf.roc, 
 col="red", 
 lwd=3, 
 main="ROC Curve",)
auc(rf.roc)

enter image description here

$\endgroup$

Your Answer

By clicking “Post Your Answer”, you agree to our terms of service and acknowledge you have read our privacy policy.

Not the answer you're looking for? Browse other questions tagged or ask your own question.