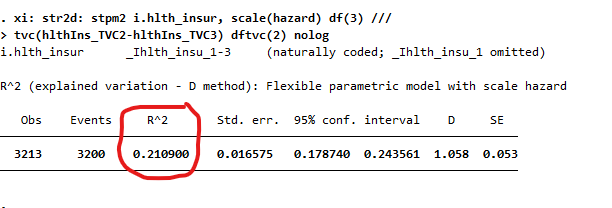
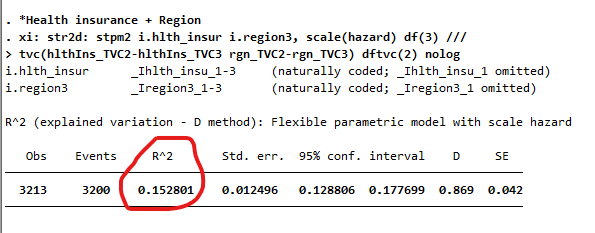
I am running a R.P. flexible parametric survival model (hazards) in Stata, using the stpm2 package and I have encountered a possibly unusual scenario. My Royston & Sauerbrei’s R^2 (not adjusted) value reduces a lot when additional predictors are added to the model - from 21% to 15% with the inclusion of a 2nd predictor. Importantly, other measures of model fit – AIC and BIC – improve when additional variables are included, and likelihood-ratio tests strongly support the inclusion of additional variables. I’ve not encountered this before and I’m wondering / concerned whether this is diagnostic of some other issue / a red flag.
My understanding is that R^2 should not strictly be interpreted as ‘amount of variance explained’ in this context, but even still, the changes seem suspicious. Is there a clear explanation for this / a broader intuition as to what might be occurring? Nothing in the helpfile or here pointed me to an explanation.
The model includes time-varying effects. However, the peculiarity exists when these are removed.
Edit: Example output - both predictors are significant in the model and individually.


