12
$\begingroup$

Say I have a set of 10 values I want to draw 3 values from, uniformly, without replacement. For instance: $$S = \{0,0,0,0,22.95,0,0,0,19.125,25.5\}$$ With replacement, this seems simple, you just add all the values up and divide by $10$, giving $6.7575$, and multiplying by $3$ you get $20.2725$. However, if you don't replace values, I imagine it could effect the expected value, but uncertain how to figure out the specifics.

I guess thinking about it as discrete distributions means that the distribution changes every time a value is drawn, and maybe isn't the best way to think about this problem?

$\endgroup$
2
  • 7
    $\begingroup$ The answer will actually be the same in either case. This is because the marginal distribution of $X_1, X_2$ and $X_3$ is the same in both cases (although the joint distributions are different). Since expectation is a linear operation, only the marginal distributions matter here. Still its good that you're thinking about this, as it's non-trivial that they are the same, and they would have different expectations for a non-linear function of $X_1, X_2, X_3$. $\endgroup$
    – knrumsey
    Commented Apr 12, 2022 at 0:01
  • 1
    $\begingroup$ For some ideas about this question and its generalizations, see this site search for answers about sampling, replacement, expectation, and indicator functions. $\endgroup$
    – whuber
    Commented Apr 12, 2022 at 12:06

3 Answers 3

12
$\begingroup$

@BruceET's answer has some nice information, and simulations are often a good starting place for this sort of thing in practice. In this answer, I'll detail an exact approach, which demonstrates that the exact answer is actually $20.275$, the same as in the sampling without replacement approach.

Note that this is unsurprising due to the linearity of expectation and the fact that, marginally, each $X_i$ has the same distribution in either case. Note that the variances will NOT be the same for each approach, as @BruceET points out in his answer.


In the sampling with replacement case, you can view each draw as an independent draw from the given discrete distribution $X_1, X_2, X_3 \stackrel{\text{iid}}{\sim} p(x)$. In the sampling without replacement case, you have to consider the joint distribution of the random variables ${\bf X} = (X_1, X_2, X_3) \sim p(x_1, x_2, x_3)$. Then the expected value of $Y = X_1 + X_2 + X_3$ is taken as the weighted average with weights given by $p(x_1, x_2, x_3)$.


More generally, let $S = \{s_1, s_2, \ldots s_n\}$. A general strategy for finding $E(X_1+X_2+X_3)$ starts by listing all of the possible outcomes, $$\mathcal S = \{(x_1, x_2, x_3) | x_1 = s_i, x_2 = s_j, x_3 = s_k, i \neq j \neq k),$$ of which there are $n(n-1)(n-2)$. Since the sum doesn't care about the order in which each number is drawn, we can simplify things a bit by looking at the set of all combinations: $$\mathcal S = \{(x_1, x_2, x_3) | x_1 = s_i, x_2 = s_j, x_3 = s_k, i < j < k),$$ of which there are $\binom{n}{3}$ options. Then the expected value can be computed as \begin{align*} E(X_1+X_2+X_3) &= \sum_{k=3}^n\sum_{j=2}^k\sum_{i=1}^j(s_i + s_j + s_k)\times 6 \times p(s_i, s_j, s_k)\\ &= \frac{6}{10\cdot9\cdot8}\sum_{k=3}^n\sum_{j=2}^k\sum_{i=1}^j(s_i + s_j + s_k) \\ &= \ldots \\ &= \frac{3}{n}\sum_{i=1}^n s_i \end{align*} where the $6$ comes from the various orderings of $s_i, s_j, s_k$. Since each element $s_i (i=1,\ldots n)$ has the same probability of being selected, we have $p(s_i, s_j, s_k) = \frac{1}{10\cdot 9\cdot 8}$ for each combination.


Example R Code

Based on a suggestion by @BruceET, this R code has been edited to compute the expected value and variance. Note that the variance is significantly smaller than the case of sampling with replacement.

compute_expected_value <- function(S){
  n <- length(S)
  E1 <- E2 <- 0
  for(i in 3:n){
    for(j in 2:(i-1)){
      for(k in 1:(j-1)){
        E1 <- E1 + 6*(S[i] + S[j] + S[k])/10/9/8
        E2 <- E2 + 6*(S[i] + S[j] + S[k])^2/10/9/8
      }
    }
  }
  res <- c(E1, E2-E1^2)
  names(res) <- c("mean", "variance")
  return(res)
}  

S <- c(0,0,0,0, 22.95, 0,0,0, 19.125,25.5)
compute_expected_value(S)

>    mean variance 
> 20.2725 253.4187
$\endgroup$
4
  • 1
    $\begingroup$ Sorry about the mistake--which should have been obvious. (+1) I agree that the expectation of the sample mean of three is the same with and and without replacement, as shown in my simulation within simulation error. But why do you say $E(\bar X_3) \ne \mu,$ the population mean? That seems another obvious contradiction. // Does some modification of your code find the standard deviations? $\endgroup$
    – BruceET
    Commented Apr 12, 2022 at 0:29
  • $\begingroup$ @BruceET I did not mean to suggest that $E(\bar X) \neq \mu$. I have scanned my answer, and I can't seem to find where I said this. Please point out (or feel free to edit) what you are referring to, so that I can edit to make the answer more clear. $\endgroup$
    – knrumsey
    Commented Apr 12, 2022 at 20:31
  • 1
    $\begingroup$ @BruceET, Maybe the confusion lies in the fact that you are looking at $(X_1+X_2+X_3)/3$, while the OP is asking about the sum $X_1+X_2+X_3$. They are of course highly related, but I am just trying to focus on how the question was asked. // I have edited the code so that it now computes both the expected value and the variance of $X_1+X_2+X_3$. $\endgroup$
    – knrumsey
    Commented Apr 12, 2022 at 20:45
  • $\begingroup$ @knrumsey +1 But there is an easier and more general way of deriving the variance. $\endgroup$ Commented Apr 12, 2022 at 22:21
8
$\begingroup$

The mean of the values in $S$ is $6.7576,$ as you say. So, with replacement, each of the three chosen values has an expected value of $6.7575$ and thus the average of the three is again $\bar X_3 = 6.7575.$

s = c(0,0,0,0, 22.95, 0,0,0, 19.125,25.5)
mean(s)
[1] 6.7575

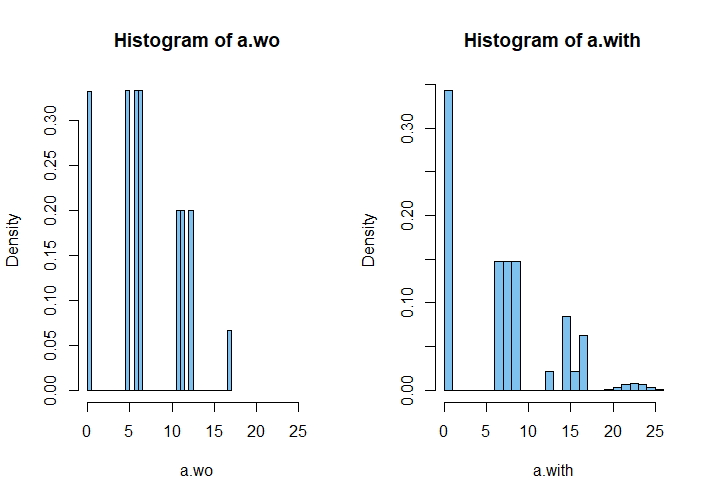
In sampling without replacement, the mean $E(\bar X_3)= 6.7575$ and the variance $V(\bar X_3)$ of the sample mean will be somewhat smaller because there are fewer possible samples of size three that may be drawn. (For example, once value $25.5$ is chosen, it can't be chosen again.)

Without working through the combinatorial detains, it is possible to get a good idea of the sampling distribution of $\bar X_3$ according to each sampling method by doing a simple simulation in R. With 10 million iterations one can expect about three place accuracy.

set.seed(3033)
s = c(0,0,0,0,22.95,0,0,0,19.125,25.5)
a.wo = replicate(10^7, mean(sample(s, 4)))
mean(a.wo);  sd(a.wo)
[1] 6.760266 # aprx 6.7575
[1] 4.254535

summary(a.wo)
   Min. 1st Qu.  Median    Mean 3rd Qu.    Max. 
  0.000   4.781   6.375   6.760  10.519  16.894 

a.with = replicate(10^7, mean(sample(s, 3, rep=T)))
mean(a.with);  sd(a.with)
[1] 6.757315   # aprx 6.7575
[1] 6.017261

summary(a.with)
   Min. 1st Qu.  Median    Mean 3rd Qu.    Max. 
  0.000   0.000   7.650   6.757   8.500  25.500 

par(mfrow=c(1,2))
hist(a.wo, prob=T, xlim=c(0,26), col="skyblue2")
hist(a.with, prob=T, xlim=c(0,26), col="skyblue2")
par(mfrow=c(1,1))

enter image description here

$\endgroup$
2
  • 1
    $\begingroup$ This seems to imply but not necessarily prove that the expected value is different, as it's only a very slight change, not too far off from your quoted accuracy. And while I'm happy to see the results of a simulation for this specific case, I'm still wondering if there's some sort of generalization of this problem that doesn't rely on simulation. Would you need to enumerate all the discrete distributions that represent the different possibilities and take their expected values? (seems harder than just simulation) Or is there some combinatoric simplification that can be made? $\endgroup$
    – brubsby
    Commented Apr 11, 2022 at 23:28
  • 1
    $\begingroup$ (1) Of course, you're right about the expectations of the sample means being the same with and without replacement. Fixed that. (2) There may be some clever combinatorial argument to show that the var is smaller w/out repl (as for comparing similar binomial and hypergeometric distributions). However, I did choose simulation because it seemed the simplest way to make the comparison. // Look at the histograms: As I said in my Answ, once value 25.5 is chosen, it can't be chosen again, so the values around 22 for w'repl are impossible w/out repl; that alone seems to make the var smaller. $\endgroup$
    – BruceET
    Commented Apr 12, 2022 at 0:41
5
$\begingroup$

When sampling without replacement from the set $S=\{s_1,s_2,\dots,s_n\}$, the sampled values $X_1,X_2,\dots,X_m$ have an exchangeable distribution. Hence, for any $k$, $E(X_k)=\frac1n\sum s_i=\bar s$ and $\operatorname{Var}X_k=\frac1n\sum_{i=1}^n s_i^2-\bar{s}^2=\bar{s^2}-{\bar s}^2$. Furthermore, for any pair $k\neq l$, \begin{align} E(X_kX_l) &=\sum_{i \neq j} s_is_j\frac{1}{n(n-1)} \\&=\frac1{n(n-1)}\sum_{i\neq j} s_is_j \\&=\frac1{n(n-1)}\left(\sum_{i,j} s_is_j-\sum_i s_i^2\right) \\&=\frac{n}{n-1}\sum_{i,j} s_is_j\frac1{n^2}-\frac{1}{n-1}\sum_i s_i^2\frac1n \\&=\frac{n}{n-1}\bar{s}^2-\frac{1}{n-1}\bar{s^2}. \tag{1} \end{align} Hence, \begin{align} \operatorname{Cov}(X_k,X_l) &=E(X_kX_l)-(EX_k)(EX_l) \\&=\frac{n}{n-1}\bar{s}^2-\frac{1}{n-1}\bar{s^2}-\bar{s}^2 \\&=\frac{1}{n-1}\bar{s}^2-\frac{1}{n-1}\bar{s^2} \\&=-\frac{1}{n-1}\operatorname{Var}X_k, \tag{2} \end{align} and \begin{align} \operatorname{Var}(X_1+X_2+\dots+X_m) &=m\operatorname{Var}(X_k)+m(m-1)\operatorname{Cov}(X_k,X_l) \\&=m\operatorname{Var}(X_k)\frac{n-m}{n-1}. \tag{3} \end{align} Thus, relative to sampling with replacement, the effect of sampling without replacement is to reduce the variance of $\sum_{k=1}^m X_k$ (and $\bar X$) by a factor of $\frac{n-m}{n-1}$.

It can also be noted that (2) can be derived more directly by setting $m=n$ in (3) such that the variance of the sum on the left hand side is zero and solving for the covariance.

Unsurprisingly, the variances of the hypergeometric and binomial distributions differ by the exact same factor.

$\endgroup$

Your Answer

By clicking “Post Your Answer”, you agree to our terms of service and acknowledge you have read our privacy policy.

Not the answer you're looking for? Browse other questions tagged or ask your own question.