3
$\begingroup$

I have the log-normal standard deviation and the mean that I want to use to sample from a log-normal distribution in Python. However after I do the sampling and compute the arithmetic mean and standard deviation I don't get the same values that plugged in. This only happens when the mean is too small, but for my case I have to work with this exact mean. Any idea on how to solve this will be greatly appreciated.

here's the code :

import numpy as np
import scipy.stats as stats
from statistics import mean
import matplotlib.pyplot as plt
import scipy.stats as stats
from math import exp
N=1000000
m = 1.75917e-7
siglog = 1.510297984
sigma= np.sqrt(np.log(1 + (siglog/m)**2)) #normal std
mu= (np.log(m) - sigma**2 / 2) #normal mean
f = stats.lognorm.rvs(sigma, loc=0, scale=exp(mu), size=N)
print(mean(f), np.std(f))

I get this result : 2.6542845542733312e-08 6.413511018978618e-06 which is very different from siglog and m.

$\endgroup$
1
  • $\begingroup$ Just a remark: numpy has its own functions np.exp, np.mean and np.std. $\endgroup$
    – Roger V.
    Commented Apr 26, 2022 at 9:13

2 Answers 2

2
$\begingroup$

The problem is that you have reversed the roles of the SD and the geometric SD in the formulas. How can one tell? It's just not plausible that any realistic distribution of positive support could have a mean near $0.0000002$ and a standard deviation of $1.5;$ whereas a geometric standard deviation of $1.5,$ although high, is not unusual in some applications.

By definition, $X$ has a Lognormal distribution with parameters $(\mu,\sigma)$ when $Y = \log(X)$ has a Normal distribution with mean $\mu$ and standard deviation $\sigma.$ Writing $m$ and $s$ for the mean and SD of $X,$ respectively, we may compute that

$$m = \exp(\mu + \sigma^2/2).$$

and

$$s = m\sqrt{\exp(\sigma^2)-1}.$$

Your code specifies $m$ and $\sigma$ -- the mean of $X$ and the SD of $Y.$ Therefore the underlying Normal mean is

$$\mu = \log(m) - \sigma^2/2.$$

Here is the fixed code and its output, whose close agreement with the intended parameters also confirms there are no problems with floating point precision. (Notice the use of norm.rvs for this test. As a rule, I do not use any platform's method to generate lognormal variates, because the conventions about specifying parameters are so varied and confusing. I always generate normal variates and exponentiate them, because then I know what I'm getting.)

import numpy as np
from statistics import mean
from scipy.stats import norm
N = 1000000
m = 1.75917e-7                        # Lognormal mean
sigma = 1.510297984                   # Normal sd
s = m * np.sqrt(np.exp(sigma**2) - 1) # Lognormal sd
mu = (np.log(m) - sigma**2 / 2)       # Normal mean
params = (mu, sigma)
np.random.seed(17)
x = np.exp(norm.rvs(*params, size = N))
print('Mean (sim): {:06.4g}'.format(mean(x)), ' Mean: {:06.4g}'.format(m), 
      ' SD (sim): {:06.4g}'.format(np.std(x)), ' SD: {:06.4g}'.format(s))
Mean (sim): 1.756e-07  Mean: 1.759e-07  SD (sim): 5.271e-07  SD: 5.215e-07
$\endgroup$
0
$\begingroup$

I did this in R and got very similar results to you, even when I tried sampling from the corresponding normal then exponentiating.

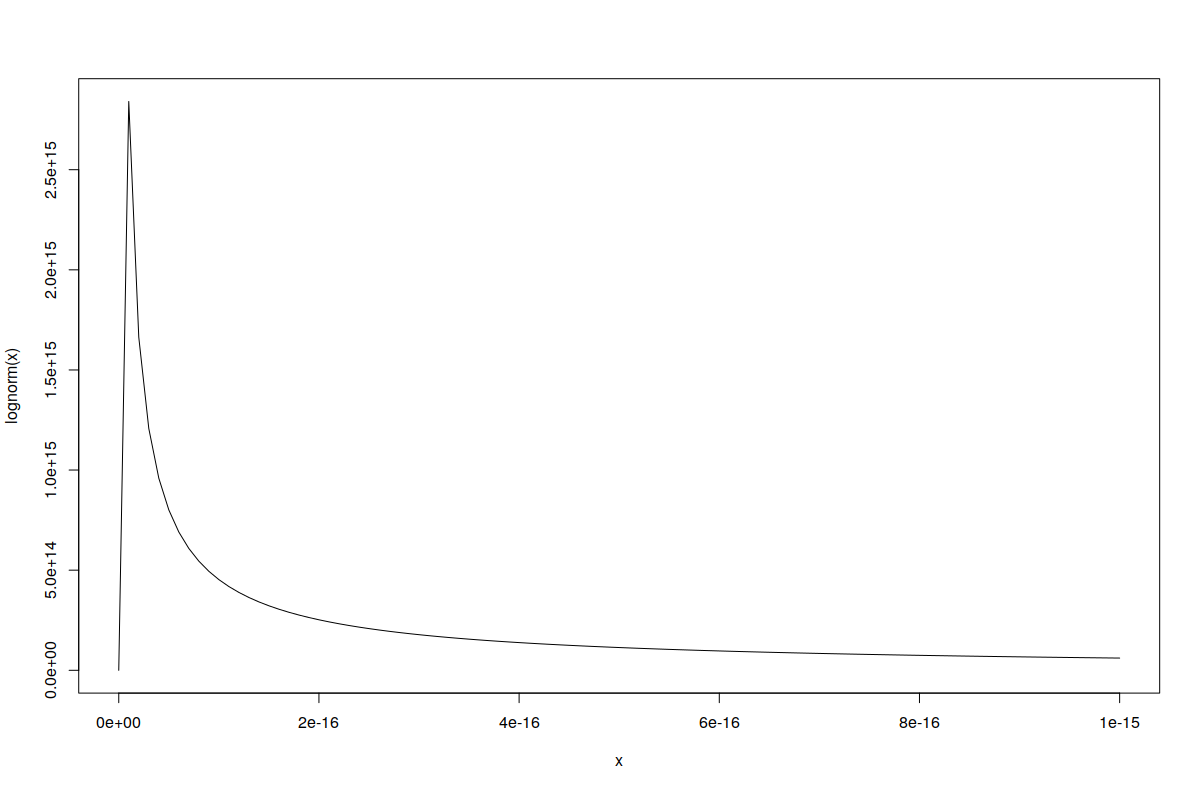
The issue here is the scale of the values you're trying to sample. Here's a plot of the density of lognorm(mu = 5.650763, sigma = -31.51881), which are the parameters corresponding to your m and siglog:

Lognormal density plot

When you're this close to the machine epsilon, weird things start to happen. For example:

> 1 + 2e-16 == 1
[1] FALSE
> 1 + 1e-16 == 1
[1] TRUE
$\endgroup$
3
  • $\begingroup$ the input data is something I cannot change. Maybe some other sampling method ? Any idea how to go around this issue ? I've been stuck for a while now. $\endgroup$ Commented Apr 26, 2022 at 12:46
  • $\begingroup$ Where does this data set come from? From a back-of-the-envelope calculation, a (non-negative) sample with this mean and standard deviation is like $10^{14}$ observations that are very close to 0, and a single data point at around $10^7$. $\endgroup$ Commented Apr 26, 2022 at 13:08
  • 1
    $\begingroup$ This data was extracted from Ecoinvent database, a software used in modelling Life cycle assessment of a product. The case of the mean being this negligible compared to the standard deviation is pretty a standard thing to find in life cycle assessment. Please see page 1532 in this reference : link.springer.com/article/10.1007/s11367-016-1101-1 $\endgroup$ Commented Apr 26, 2022 at 13:42

Your Answer

By clicking “Post Your Answer”, you agree to our terms of service and acknowledge you have read our privacy policy.

Not the answer you're looking for? Browse other questions tagged or ask your own question.