12
$\begingroup$

I have a random variable $X$ which is related to another random variable $Y$ as $Y = \text{cos}(X)$, where $X \in [0, \pi/2]$, and I would like to know what distribution I should sample $X$ from in order that $Y$ has a uniform distribution. A simple Jacobian transformation says that

$f(Y) = |\frac{\partial X}{\partial Y}| f(X)$

which suggest that in order to have $f(Y) = 1$ (i.e. uniform), we should equate $f(X) = |\frac{\partial Y}{\partial X}| $. In this specific example that would mean we need to sample $x$ from the distribution $f(X) = |\text{sin(X)}|$.

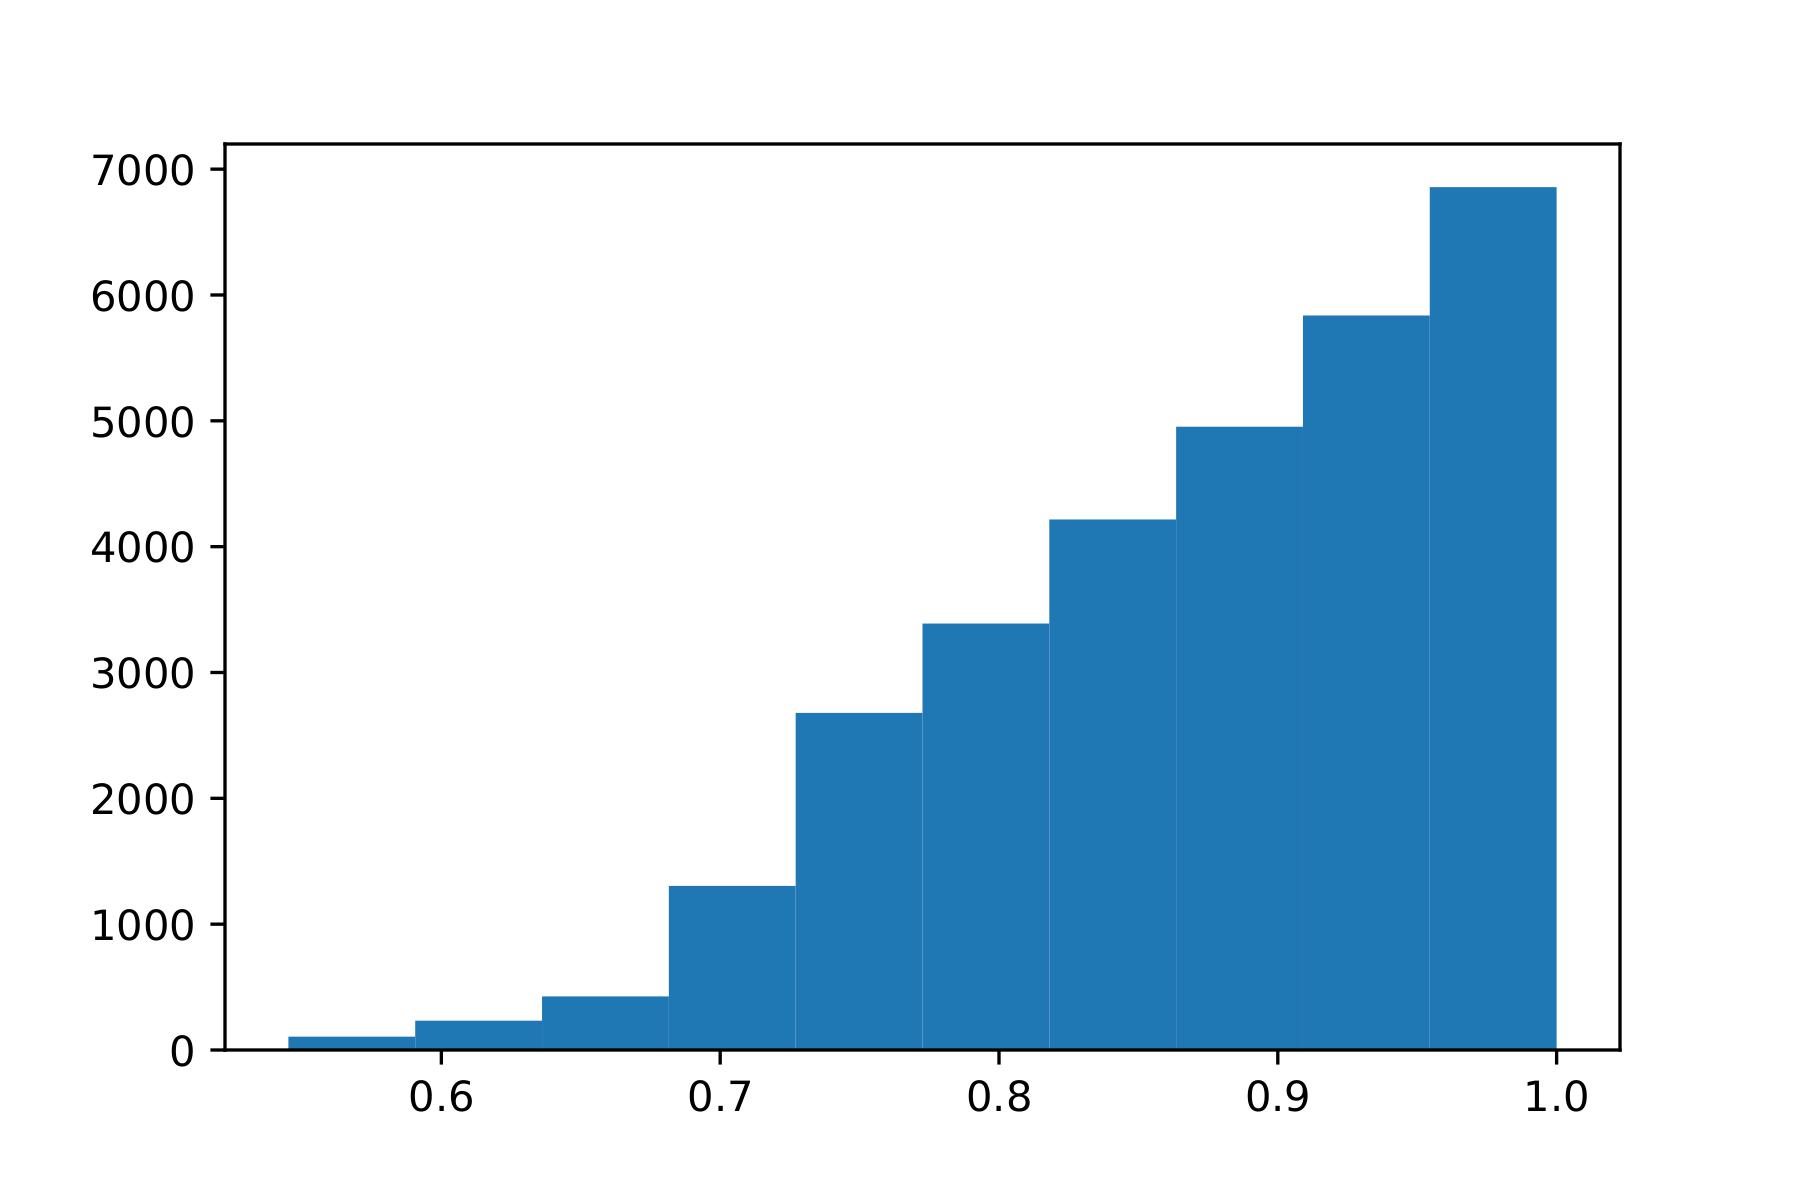
However when I do this in practice i.e. I plug a sample of $x$ values drawn from a sine distribution into the cosine, the resulting distribution of $y$ values is not uniform at all, but rather looks like this.

enter image description here

Could someone please point out what I am doing wrong?

Thanks in advance.

$\endgroup$
5
  • $\begingroup$ Note that $f(x) = \sin(x)$ has negative values; I assume you meant $|\sin(x)|$? Also, what range does $x$ have? $\endgroup$
    – jbowman
    Commented May 11, 2022 at 16:32
  • $\begingroup$ Yes sorry! Will edit the op. The x variable has a range $x \in [0, \pi/2]$ $\endgroup$
    – Pronitron
    Commented May 11, 2022 at 16:33
  • $\begingroup$ I also wonder how you are generating random numbers from $|\sin(x)|$. When I do this, I get a uniform distribution... $\endgroup$
    – jbowman
    Commented May 11, 2022 at 16:39
  • $\begingroup$ Hmm so it seems my idea is correct then but the implementation is somehow flawed? I am trying to do as schotti below suggests, which is to use the inverse CDF of $|\text{sin}(X)|$ to generate samples based on drawing another variable $Z$ from a uniform distribution i.e. $X=G^{-1}(Z) = |\text{arcos}(Z)|$. I guess it should work, but doesn't seem to for some reason... $\endgroup$
    – Pronitron
    Commented May 11, 2022 at 16:50
  • 1
    $\begingroup$ A very closely related thread, whose techniques are all applicable here, is stats.stackexchange.com/questions/138763. $\endgroup$
    – whuber
    Commented May 11, 2022 at 16:51

4 Answers 4

14
$\begingroup$

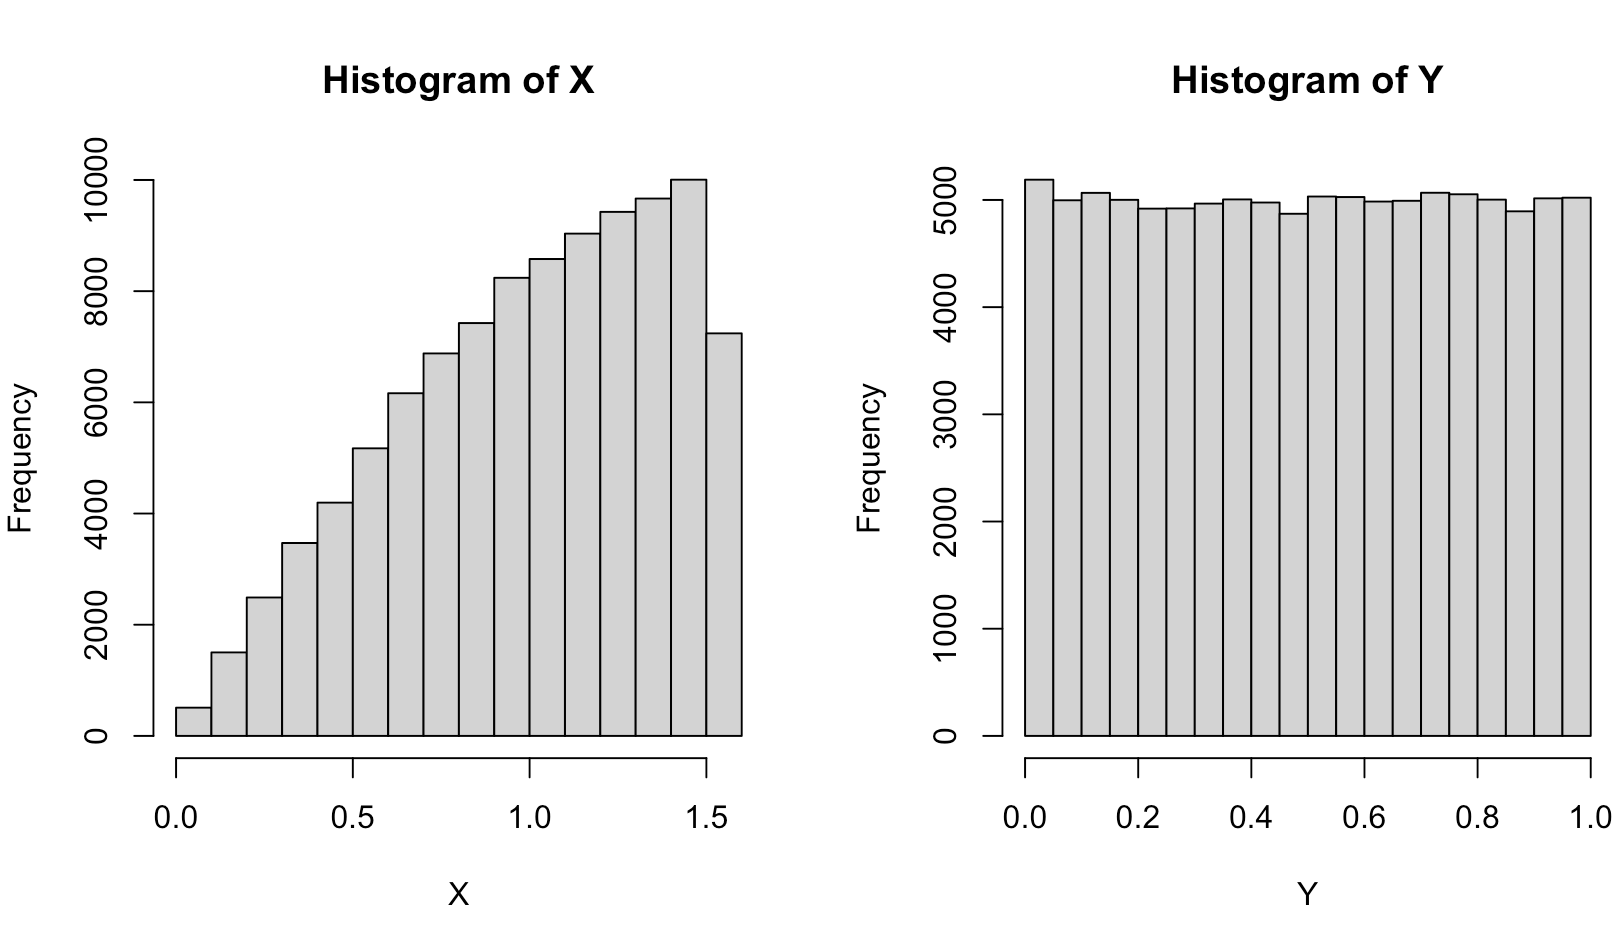
maybe i misunderstand your question, but why don't you sample from a uniform distribution and set X to the arccos of your samples?

in R, this would be

X <- acos(runif(100000))
hist(X)
Y <- cos(X)
hist(Y)

enter image description here

$\endgroup$
1
  • 1
    $\begingroup$ I think the OP wants to test the derivation of $f(x) = |\sin(x)|$... although your approach certainly works for what it does. $\endgroup$
    – jbowman
    Commented May 11, 2022 at 16:46
13
$\begingroup$

I suspect the difficulty you are having is in the generation of $x$ from $f(x) \propto |\sin(x)|$. I have coded a very simple acceptance-rejection random number generator in R that will do the job:

# Accept-reject algorithm
rsin <- function() {
  repeat {
    u <- runif(1, 0, 2*pi)
    u2 <- runif(1)
    if (u2 <= abs(sin(u))) break
  }
  u
}

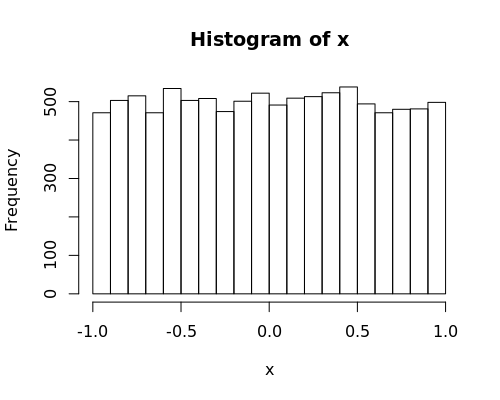
Running the resultant random numbers through the cosine tranformation yields:

x <- rep(0, 10000)
for (i in seq_along(x)) {
  x[i] <- cos(rsin())
}

hist(x)

enter image description here

which would seem to support your derivation!

$\endgroup$
2
$\begingroup$

The question doesn't require a specific programming language, which is fine, but I noted that the OP's plot looks like the default style of . @jbowman has given a useful implementation. Here is a similar implementation in case the OP would like to continue their project in .

First we can define a function rsin.

import numpy as np

def rsin(n):
    results = np.zeros(n)
    for i in range(n):
        while True:
            u = np.random.uniform(0, 2*np.pi)
            u2 = np.random.uniform()
            if u2 <= np.abs(np.sin(u)):
                results[i] = u
                break
    return results

And then we can plot the results using .

import matplotlib.pyplot as plt

plt.hist(np.cos(rsin(10000)), bins=20)
plt.show()

Which produces the following plot:

enter image description here


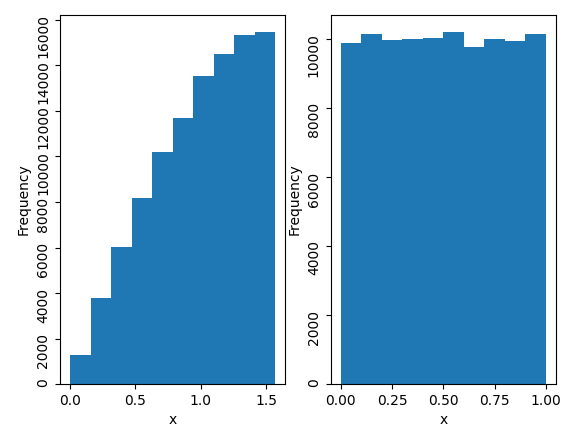
@schotti's approach can be given (ignoring some of the style elements) in as follows.

import matplotlib.pyplot as plt

x = np.arccos(np.random.uniform(size=10**5))
y = np.cos(x)

fig, axes = plt.subplots(1,2)

axes[0].hist(x)
axes[1].hist(y)

for axis in axes:
    axis.set_xlabel('x')
    axis.set_ylabel('Frequency')
    axis.tick_params('y', labelrotation=90)

plt.show()

enter image description here

$\endgroup$
0
0
$\begingroup$

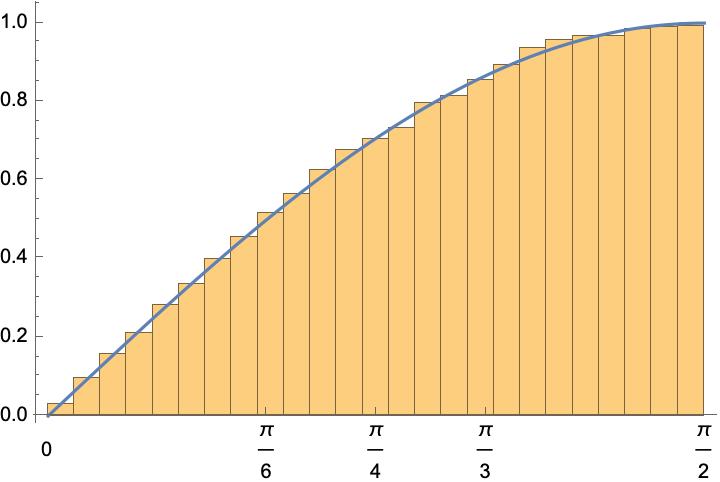
There is no need for absolute values around your sine function. f(x) = sin(x) is a perfectly fine pdf on the sample space [0, pi/2]. As schotti points out, you can create an RV with this pdf by taking the inverse cosine (arccos) of a standard uniform RV; this follows from the Jacobian transformation that you have given in your question. That being the case, undoing the arccos by applying the cosine will obviously take you back to the standard uniform that you began with. Don't believe this? Here is an image of a pdf histogram (total area = 1) for a sample of 10^5 standard uniforms transformed by arccos, with the graph of sine superimposed. Clearly, this works.

Sine PDF

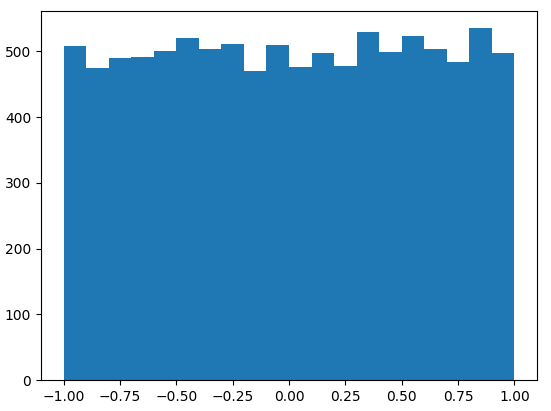
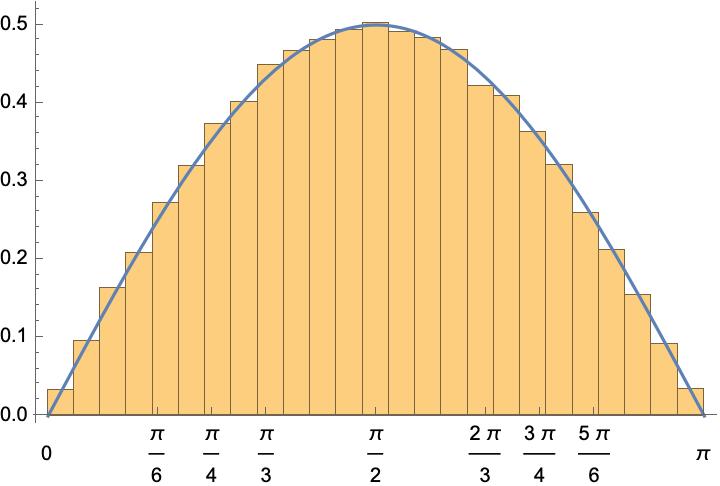
It's important to use a standard uniform, with sample space [0,1] as input of the arccos and the output of the cosine. Obviously, if the upper endpoint is greater than 1, you will get errors from the arccos, and impossible values for the cosine transformation. The real danger is negative values. If your uniform variable input generates negative values, arccos will take you to values above pi/2, and you cease to have sine as a valid pdf. You could work with a uniform RV with sample space [-1,1], but the RV resulting from the arccos will have sin(x)/2 as its pdf, not the sin(x) that you desire. Here is that situation:

enter image description here

$\endgroup$

Your Answer

By clicking “Post Your Answer”, you agree to our terms of service and acknowledge you have read our privacy policy.

Not the answer you're looking for? Browse other questions tagged or ask your own question.