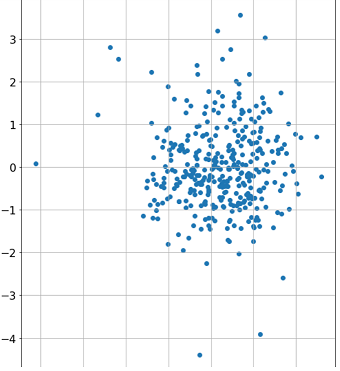
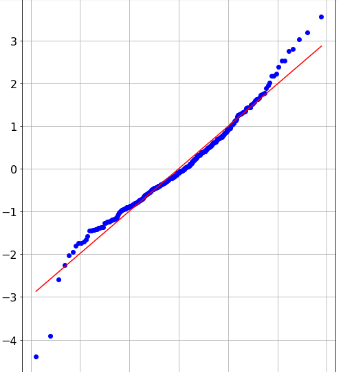
I have a data set where some x input has a 0.59 Pearson correlation with variable y (sample size is about 300). After performing simple linear regression I get the following standardized residuals scatter plot and qq plot:
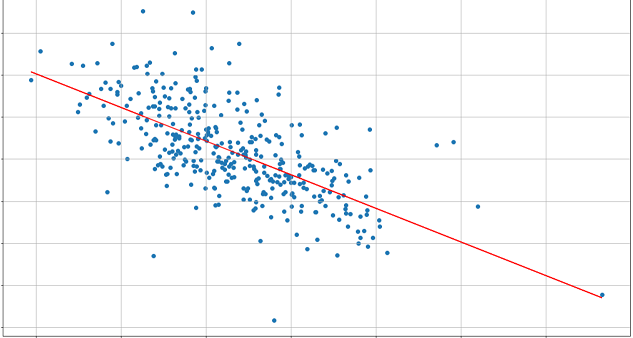
Regression result and scatter plot relating x to y:
The residuals scatter plot seems fairly random with no discernible pattern to me, but the QQ plot shows a slight curvature and Shapiro-Wilk test rejects the null hypothesis so I assumed there might be some non linear relationship between x and y. I tried then applying a few transformations like sqrt(x), log(x) or x^2 to the input vector and to my surprise the Pearson correlation barely changes.
With x^2 it goes down to 0.58, for log(x) and sqrt(x) the correlation increases by about 0.002 and 0.003 compared to just x. Performing regression on the transformed variable also yields very similar results to the non transformed variable and the QQ plot still shows the same slight curvature.
At first I thought there was a mistake in my code, but I checked it several times and I'm fairly confident that's not the case, so now I'm wondering what kind of conclusions can I take away from this. Maybe y is related to x through a combination of linear and non linear terms? Maybe some other unknown variable that is collinear to x but has non linear relation to y is the cause of the curvature in the QQ plot? Maybe there's some other variable transformation I haven't tried that could explain it? What other method could I use to further explore the relationship between the two variables?


