1
$\begingroup$

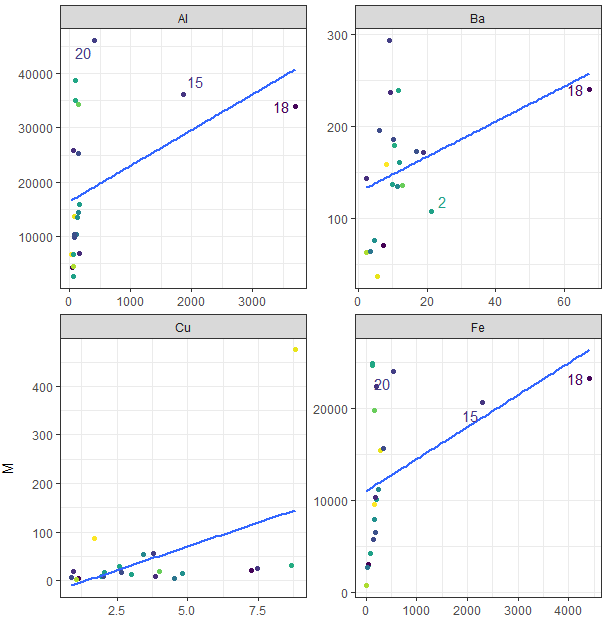
I am studying the relationship between the concentration of metals in organisms (Y axis in the image) and the environment (X axis). The regressions are not very good due to some outliers, and I want to prove this by doing regression models with and without the outliers.

My problem is: how do I determine what values are outliers? I can see it very clearly in the graphs, but I've tried different methods and none seemed to work. I've tried detecting bivariate outliers, but it assumes values are clustered and not in a line. I also tried to use the cook distance, but when there are a few clustered outliers it doens't work either.

What approach could I use?

Part of my data

$\endgroup$

1 Answer 1

3
$\begingroup$

Robust regression methods such as the MM-estimator (computed by R's command lmrob in package robustbase) weight outliers down in a smooth way. This is better than removing outliers from least squares (LS) regression, and also takes care of masking effects, i.e., the fact that some outliers may "mask" the presence of others in diagnostics from LS regression. They will also provide outlier identification if required, however the idea of that is not to remove the outliers from the data, because they have been dealt with appropriately by robust regression in the first place. You can demonstrate that there is an outlier problem comparing the LS with the MM-regression.

$\endgroup$
1
  • $\begingroup$ Thank you! This method is indeed very useful to detect outliers. I should say that I don't want to remove outliers to have a good fit, but only to prove that a few ouliers are responsible for a bad one. This approach is definitely a more elegant one. $\endgroup$
    – Antón
    Commented Jun 2, 2022 at 8:45

Your Answer

By clicking “Post Your Answer”, you agree to our terms of service and acknowledge you have read our privacy policy.

Not the answer you're looking for? Browse other questions tagged or ask your own question.