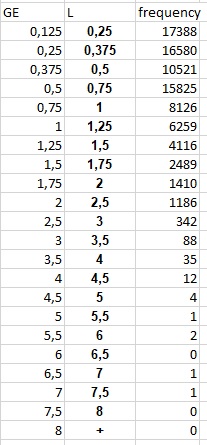
I have the data like below. I woud like to fit Weibull (or Gamma) distribution without multiplying each case in the interval (what fitdistrplus requires). Does anyone know smarter method?
-
1$\begingroup$ What do the "GE" and "L" columns mean? Is the frequency the frequency of all values greater than something or would it be the frequency within a given bin bounded by "GE" and "L"? Why are there no frequencies less than $0.125$? $\endgroup$– whuber ♦Commented Jun 24, 2022 at 19:02
-
$\begingroup$ I took them to stand for $\ge$, and $<$. $\endgroup$– Glen_bCommented Jun 24, 2022 at 23:14
-
$\begingroup$ Is there some theoretical reason why there are no observations between 0 and 0.125? $\endgroup$– JimBCommented Jun 25, 2022 at 2:09
-
$\begingroup$ For an implementation in Mathematica see mathematica.stackexchange.com/questions/203547/…. $\endgroup$– JimBCommented Jun 26, 2022 at 3:13
2 Answers
This is just an add-on to @Glen_b 's answer. Here's is one way to get the estimates and standard errors using R.
As you’ve mentioned your data is censored in that there are frequency counts for each of several bins. For a maximum likelihood estimator of the distribution parameters you’ll need to determine the cumulative distribution function (cdf) of the distribution of interest.
Given your data there appears to be (at least) 3 possibilities for defining a Weibull distribution to be fit. You’ll need to decide which one (if any) is appropriate. Here are the descriptions along with the associated cdf:
- A Weibull distribution with a location parameter of 0 (the usual 2-parameter Weibull distribution). For $x\geq0$ the cdf is
$$1-e^{-(\frac{x}{b})^a}$$
- A Weibull distribution with a location parameter of 0.125 (as the left-most bin is 0.125 and there are no observations between 0 and 0.125). For $x\geq0.125$ the cdf is
$$1-e^{-(\frac{x-0.125}{b})^a}$$
- A truncated Weibull in that only observations greater than 0.125 are considered. (Here there is censored data from a truncated Weibull.) For $x\geq0.125$ the cdf is
$$(1-e^{-(\frac{x}{b})^a})e^{(\frac{0.125}{b})^a}$$
So one needs to write a function for the desired distribution. Here I’ll just construct the function for the truncated Weibull.
bins <- c(0.125, 0.25, 0.375, 0.5, 0.75, 1, 1.25, 1.5, 1.75, 2, 2.5, 3, 3.5, 4,
  4.5, 5, 5.5, 6, 6.5, 7, 7.5)
f <- c(17388, 16580, 10521, 15825, 8126, 6259, 4116, 2489, 1410, 1186, 342, 88,
  35, 12, 4, 1, 2, 0, 1, 1)

cdf <- function(x, a, b) (1-exp(-(x/b)^a))*exp((0.125/b)^a)

logL <- function(ab, bins, f) {
  n <- length(bins)
  sum(f * log(cdf(bins[2:n], ab[1], ab[2]) -
              cdf(bins[1:(n-1)], ab[1], ab[2])))
}

results = optim(c(1.4, 0.7), fn=logL, bins=bins, f=f, control=list(fnscale=-1),
  hessian=TRUE)
Here are the results:
# Parameter estimates
  results$par
# [1] 1.0280321 0.5159474

# Standard errors
  diag(solve(-results$hessian))^0.5
# [1] 0.004905767 0.002835328

# Plot the data histogram and density function
  a = results$par[1]
  b = results$par[2]
  x = 0.125 + 4*c(0:1000)/1000
  plot(c(0, 0.125, x), c(0, 0, (a*exp(0.125**a*(1/b)**a - (x/b)**a)*(x/b)**(-1 + a))/b),
    las=1, ylab="Probability density", xlab="x", main="Truncated Weibull fit",
    type="l", col="red", lwd=3, ylim=c(0,2))
  total <- sum(f)
  area <- 0
  for (i in 1:length(f)) {
      h <- (f[i]/total)/(bins[i+1]-bins[i])
      area <- area + h*(bins[i+1]-bins[i])
      lines(c(bins[i],bins[i], bins[i+1], bins[i+1], bins[i]), c(0,h,h,0,0))
  }
  area # Check that the area totals to 1
  # [1] 1
-
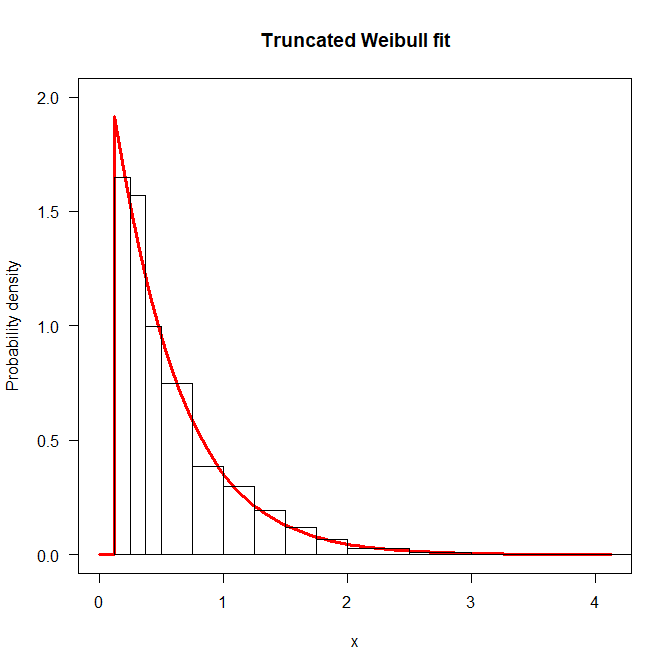
1$\begingroup$ You would do well to plot the data (as a density histogram) and the fit (as a PDF). That will show just how bad this solution is for these particular data. $\endgroup$– whuber ♦Commented Jun 24, 2022 at 21:36
-
1$\begingroup$ @whuber How could I forget Rule 1?: "Plot the data". Thank you. $\endgroup$– JimBCommented Jun 24, 2022 at 21:40
-
$\begingroup$ A good answer with a plot becomes a great answer! +1 $\endgroup$– whuber ♦Commented Jun 25, 2022 at 1:07
-
$\begingroup$ @SextusEmpiricus Yes, I did not include them (and all of the other bins out to infinity) because there were counts of zero. The log likelihood contribution would be zero times the log of a probability which would contribute zero. And that's exactly what GlenB has in his answer: $n_i \log(p(\theta))$. Or maybe I'm missing something (which wouldn't be the first time). $\endgroup$– JimBCommented Jun 25, 2022 at 8:01
-
1$\begingroup$ @SextusEmpiricus I'm just guessing that there is some reason why the data starts at (at least) 0.125 but it is not uncommon to have a third parameter for a Weibull. Of course, this is why folks should really describe "how" they got their numbers as opposed to just presenting the naked numbers. That would help tell us what is an appropriate analysis. Also, would what you describe be "truncation" rather than "censoring" ? (The leaving off of values from 0 to 0.125.) $\endgroup$– JimBCommented Jun 25, 2022 at 8:06
You have interval censored data (as you seem to be aware).
https://en.wikipedia.org/wiki/Censoring_(statistics)#Types
You could fit either distribution by maximum likelihood; it's a matter of writing the likelihood for the censored data and maximizing it (see the section on likelihood at that page above). Obvious start values to use would be the ML estimates you get by just placing all the data at the center of each interval. The full ML estimates will be very likely to only differ slightly from those so convergence should be only a step or two.
The likelihood could be written in grouped form using the counts, so grouped or ungrouped should not be a big issue.
If one observation is between $b_i$ and $b_{i+1}$ (with $b_{i+1}>b_i$), its likelihood is $p_i=F(b_{i+1})-F(b_i)$ (the cdf, $F$ is a function of the parameters). You can write the likelihood for all the observations from the multinomial, in terms of those $p_i$ values and the counts in each bin ($n_i$), and so in turn as a function of the parameters. Note that if you're just optimizing, the combinatorial term in the multinomial is just an additive constant in the log-likelihood, so you could optimize $\sum_i n_i\log(p_i(\theta))$, where $\theta$ is the vector of parameters.
You will then need some optimizer (some will require derivatives, some will not). One specifically designed for ML estimation (there are some in R for example), should give you standard errors as well.
Alternatively to this direct approach, you may be able to use parametric survival regression models to get ML estimates without even having to write that censored likelihood at all (at the cost of having some small additional setup for the data). Not every implementation of such models will work with just the counts in each bin though; some may assume you have individual data (though it shouldn't be hard to check whatever implementations you have access to).
If you would be happy with an approximate (asymptotically efficient) answer, it's simple enough to write the goodness of fit for either model in terms of a chi-squared statistic and use minimum chi-squared estimation.
https://en.wikipedia.org/wiki/Minimum_chi-square_estimation
It works directly with the counts, so it's already grouped in the way you want.
Berkson's paper (which is listed in the Wikipedia article) does a good job of explaining its usefulness and simplicity; in this instance you will still end up performing the same task - calling some optimizer to take you from the initial estimates to the 'optimized' values.
If you replace that multinomial Pearson chi-squared statistic with the multinomial G-statistic you should get back to to the interval-censored ML estimates.
None of this is to suggest that either model will be a good choice (i.e. will 'fit' these data).
One thing that seems a particular issue is you seem to have a possible detection threshold at the left end (no values between 0 and 0.125, though the detection threshold may differ from 0.125); this will tend to make any model like the Weibull, lognormal, gamma, etc unsuitable unless you account for that apparent truncation.


