1
$\begingroup$

I have a dataset of roughly 1000 measurements of body size in an invertebrate species collected from 15 different sites, with substantially variying sample size per site. Now I want to test how the concentration of three amino acids in the substrate collected at each site affects body size, so the concentration of each amino acid can only take 15 different values.

Thinking of the types of analysis I want to do using these continuous data (regression and bayesian type): Does it matter that my independent variable is not as continuous as my dependent variable? i.e., one can take 1000 values, the other only 15

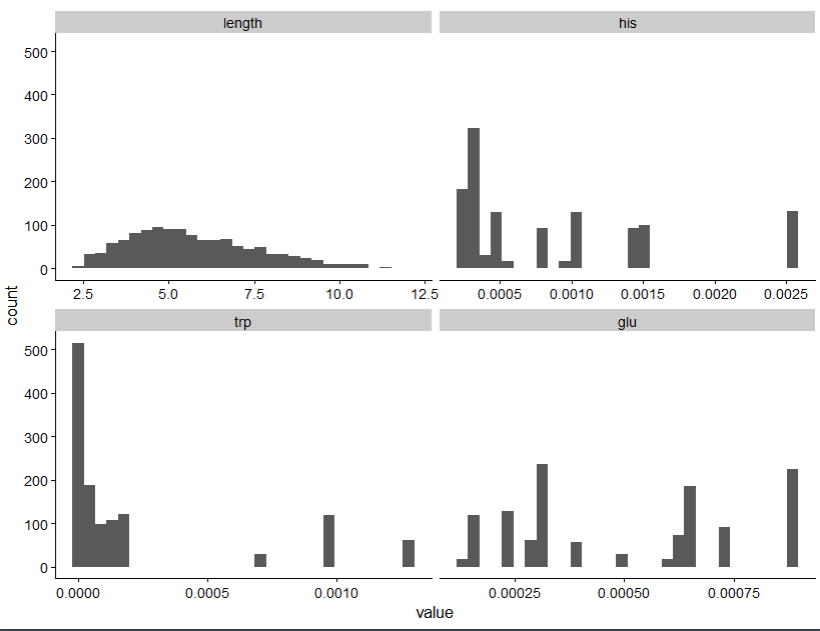
The distributions just look so different:

enter image description here

$\endgroup$
1
  • $\begingroup$ It should not be a problem if the assumptions of your model are fulfilled. For example, if you apply the linear regression approach, it won't be a problem if the assumptions of homoscedasticity, no autocorrelation, normality of errors etc. are fulfilled. Alternatively, you could also try to standardize the variables to change their scaling. $\endgroup$ Commented Jul 8, 2022 at 6:44

1 Answer 1

0
$\begingroup$

You have ~1000 measurements taken from 15 sites, so naturally there is more variability in body size (between specimen) than variability in amino acid concentration (between sites). This is not an issue for the validity of a model for body size as a function of amino acid concentration. (Aside: Assuming that you observe the same species at multiple sites, your data is crossed: species by sites. You have to account for this structure in the model to estimate the residual error correctly.)

However, it does have implications for the statistical power of your analysis. For the purpose of studying the relationship between amino acid concentration and body size, the sample size is 15. In other words, you would have been able to learn more about how amino acids affect length from more sites with fewer samples from each site.

Finally, it may be more informative to plot body size (length) against each amino acid concentration (trp, glu, his), optionally using shape and color of points to indicate site. This should give a better visual representation of the variability of body size across concentration and, qualitatively, about power.

$\endgroup$

Your Answer

By clicking “Post Your Answer”, you agree to our terms of service and acknowledge you have read our privacy policy.

Not the answer you're looking for? Browse other questions tagged or ask your own question.