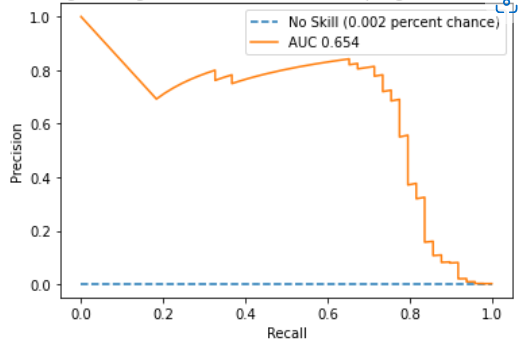
I have trained a classifier I am experimenting on, using a highly imbalanced data set (284,807 transactions and out of them 370 are of class 1) and I get the following results.
          precision    recall  f1-score   support

       0       1.00      0.97      0.98     28432
       1       0.05      0.92      0.09        49
I use the predict_proba function from sklearn to get the probabilities matrix, and then I use the precision_recall_curve(test_labels, prob[:, 1]) to get the Precision and the Recall for my plot. But the resulting plot I get from pyplot.plot(recall, precision) comes out like this:
My question is it possible to have those results and still get a Precision Recall Curve looking like that and if yes how is it explained?
Thank you in advance for any answers.

