20
$\begingroup$

I make my first steps in Machine Learning. I created a simple model using python sklearn module, but I can't figure out a basic thing. I expect that precision and recall should be monotonic functions of the predicted probability threshold. These are my predicted probability values and labels:

p = [ 0.689,  0.816,  0.846,  0.19 ,  0.527,  0.846,  0.846,  0.73 ,
    0.846,  0.762,  0.22 ,  0.958,  0.223,  0.658,  0.481,  0.846,
    0.134,  0.77 ,  0.57 ,  0.846,  0.482,  0.846,  0.846,  0.846,
    0.846,  0.846,  0.757,  0.457,  0.934,  0.902,  0.846,  0.326,
    0.846,  0.205,  0.396,  0.143,  0.553,  0.683,  0.846,  0.706,
    0.91 ,  0.18 ,  0.591,  0.769,  0.   ,  0.112,  0.546,  0.449,
    0.195,  0.2  ,  0.689,  0.883,  0.692,  0.812,  0.213,  0.843,
    0.846,  0.155,  0.514,  0.59 ,  0.495,  0.846,  0.717,  0.74 ,
    0.121,  0.866,  0.266,  0.925,  0.915,  0.151,  0.846,  0.531,
    0.846,  0.176,  0.846,  0.849,  0.813,  0.846,  0.543,  0.19 ,
    0.875,  0.846,  0.846,  0.466,  0.846,  0.197,  0.583,  0.646,
    0.186,  0.683,  0.841,  0.205,  0.725,  0.846,  0.302,  0.134,
    0.846,  0.846,  0.993,  0.437,  0.663,  0.559,  0.421]

v = [False, False, False,  True, False, False,  True, False, False,
       False,  True, False,  True, False, False, False,  True, False,
        True, False,  True, False, False,  True, False, False,  True,
        True,  True, False, False,  True, False,  True,  True,  True,
        True,  True, False, False, False,  True,  True,  True,  True,
        True, False, False,  True,  True, False, False, False, False,
        True, False, False,  True,  True,  True, False, False, False,
       False,  True, False,  True, False, False,  True,  True, False,
       False,  True, False, False,  True, False,  True,  True, False,
       False,  True,  True, False,  True, False, False,  True,  True,
       False,  True,  True, False,  True,  True, False, False, False,
        True, False, False,  True]

I now compute precision and recall values:

pre, rec, thr = metrics.precision_recall_curve(v, p)

... and plot them:

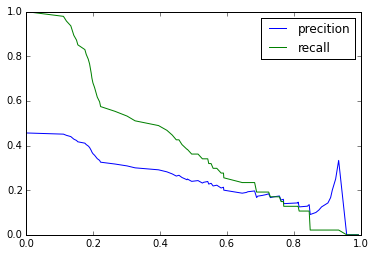
plt.plot(thr, pre[:-1], '-', label='precition')
plt.plot(thr, rec[:-1], '-', label='recall')
plt.legend()

And this is what I get:

my precision recall graph

What is going on? why isn't this graph more similar to what we see here? Is the problem with my model or with how I use the precision_recall_curve function?

$\endgroup$

3 Answers 3

23
$\begingroup$

This may be counterintuitive, but precision is not necessarily monotonically decreasing in terms of the classification threshold. On the other hand, recall is monotonically increasing. (I am assuming you rank data in terms of decreasing classifier scores, which appears opposite to what your example does, but does not change the conclusion)

The definitions of precision and recall are: $$ \begin{align} precision &= \frac{TP}{TP+FP}, \\ recall &= \frac{TP}{TP+FN}, \end{align} $$ with TP, FP and FN the number of true positives, false positives and false negatives, respectively.

Suppose, after sorting the true labels by the corresponding classifier scores, we obtain the following:

$$[False, True, False, True, True, True, False, False],$$

which leads to the following points in precision-recall space:

$$ \begin{align} precision &= [0, \frac{1}{2}, \frac{1}{3}, \frac{2}{4}, \frac{3}{5}, \frac{4}{6}, \frac{4}{7}, \frac{4}{8}], \\ recall &= [0, \frac{1}{4}, \frac{1}{4}, \frac{2}{4}, \frac{3}{4}, \frac{4}{4}, \frac{4}{4}, \frac{4}{4}]. \end{align} $$

As you can see, recall is monotonically increasing but precision has a maximum somewhere in the middle of the ranking ($\frac{4}{6})$. The shape of precision in terms of threshold can take any form, but usually you will have high precision at high thresholds and vice versa.

Note that precision is undefined at cutoffs that are higher than the highest we observed (0/0), but usually we say this is 0, for example when computing area under the precision-recall curve.

$\endgroup$
2
  • $\begingroup$ sklearn shows different results than what you've states (which I think is right) $\endgroup$ Commented Jul 14, 2017 at 18:22
  • $\begingroup$ +1 for the concrete example, however some of the pr-curves (see scikit-learn.org/stable/auto_examples/model_selection/…) have (precision=1, recall=0), what the heck? How come? $\endgroup$
    – avocado
    Commented Dec 23, 2017 at 9:14
5
$\begingroup$

To add on Marc Claessen's answer, I'd like to point out that the precision_recall_curve method of scikit-learn appends one additional data point of (recall=0, precision=1) to the returned arrays. As stated in the corresponding description:

The last precision and recall values are 1. and 0. respectively and do not have a corresponding threshold. This ensures that the graph starts on the y axis.

If the calculated recall and precision scores include a pair of (precision=0, recall=0). There will be two conflicting precision values for recall=0 (0 and 1), which could lead to artifacts.

$\endgroup$
1
$\begingroup$

Let's look at the ratio between $P=\frac{TP}{TP+FP}$ and $R=\frac{TP}{TP+FN}$. The latter, can be actually be rewritten as $R=\frac{TP}{P}$ so now the denominator is independent of threshold. Let's look at the ratio between $P$ and $R$. $\frac{P}{R}=\frac{P}{TP+FP}$

How will this ratio change when we decrease the threshold?

  • $TP$ goes up reaching P (more P examples pass the threshold)
  • $FP$ goes up reaching N (more N examples pass the threshold)

Thus, the ratio is monotonic decreasing. Now, that does not mean the graph is monotonic decreasing. To see that, let's denote $P/R=\alpha$ and now $P=\alpha*R$ when we increase $R$ will $P$ increase or decrease? Well, it depends what is "faster" $R$ growing or $\alpha$ decreasing.

Let's look at the limits:

  • low threshold: $P=\frac{P}{N+P}=\Pr(P)$ while $R=1$ and
  • high threshold $R=0$ and $P=\frac{0}{0}$ undefined , yet if we increase it a bit, assuming the classier is good, the first samples above the threshold will be TP and not FP, so $P\sim1$. Note: this is why in scikit-learn they synthetically inject R=0, P=1 to the precision recall curve function:

The last precision and recall values are 1. and 0. respectively and do not have a corresponding threshold. This ensures that the graph starts on the y axis.

TLDR, the graph of $P$ vs $R$ tends to go down as threshold decreases. However, the exact shape depends on the rate of change between the TP, FN, FP factors above and cannot be guaranteed to be monotonic decreasing.

$\endgroup$

Your Answer

By clicking “Post Your Answer”, you agree to our terms of service and acknowledge you have read our privacy policy.

Not the answer you're looking for? Browse other questions tagged or ask your own question.