1
$\begingroup$

Trying to do CV for my polynomial regressor. However, for some polynomial degrees:as the polynomial degree increases, R^2 decreases (e.g., R^2 for degree 2 is 0.6 while for degree 3 is 0.28), why is that?

lin_regressor = LinearRegression()

# pass the order of your polynomial here  
poly = PolynomialFeatures(1)

# convert to be used further to linear regression
X_transform = poly.fit_transform(x_train)

# fit this to Linear Regressor
linear_regg=lin_regressor.fit(X_transform,y_train)

linear_regg.coef_

from sklearn.model_selection import cross_val_score
    from sklearn.model_selection import KFold
    from sklearn.metrics import r2_score
    
crossvalidation_poly = KFold(n_splits=3, shuffle=True) 

#for train_index, test_index in crossvalidation_poly.split(X_normalized):


for i in range(1,11):
    poly_cross_validation = PolynomialFeatures(degree=i)
    X_current = poly.fit_transform(X_normalized)
    model = lin_regressor.fit(X_current, y_for_normalized)
    scores = cross_val_score(model, X_current,y_for_normalized, scoring='r2', cv=crossvalidation_poly,
 n_jobs=1)
    

    print("\n\nDegree-"+str(i) +" polynomial: R^2 for every fold: " + str(np.abs(scores)))
          
          #+" training: " + str(np.abs(train_index))+" \ntesting: " + str(np.abs(test_index)))

    print('\033[1m'+"Degree-"+str(i)+ '\033[1m'+ " polynomial: Average R^2 for all the folds: " + str(np.mean(np.abs(scores))) + '\033[0m'+ ", STD: " + str(np.std(scores)))


Degree-1 polynomial: R^2 for every fold: [0.41300831 0.45801624 0.17011995]
Degree-1 polynomial: Average R^2 for all the folds: 0.34704816498535956, STD: 0.2860884371794798


Degree-2 polynomial: R^2 for every fold: [0.75123033 0.85035531 0.40642591]
Degree-2 polynomial: Average R^2 for all the folds: 0.6693371814650284, STD: 0.19025980734977752


Degree-3 polynomial: R^2 for every fold: [0.30689692 0.1496736  0.38827092]
Degree-3 polynomial: Average R^2 for all the folds: 0.28161381160006743, STD: 0.23675178460286633


Degree-4 polynomial: R^2 for every fold: [0.7209975  0.40749117 0.84886534]
Degree-4 polynomial: Average R^2 for all the folds: 0.6591180032208857, STD: 0.18542670407038087
$\endgroup$
13
  • 1
    $\begingroup$ Welcome to Cross Validated! Why do you think this behavior shouldn’t happen? $\endgroup$
    – Dave
    Commented Aug 11, 2022 at 3:24
  • $\begingroup$ @Dave, thank you. My understanding is that if I have n data points a perfect fit for the data will be for a polynomial with (n-1) degree. As the polynomial degree increases, it'll fit the data better (yet, the model will become more complex and prone to overfitting)? But maybe you can correct my understanding... $\endgroup$
    – Z47
    Commented Aug 11, 2022 at 3:26
  • $\begingroup$ 1) I don’t think you reach $(n-1)$-degree polynomials, do you? $\text{//}$ 2) Why shouldn’t the $R^2$ decrease and then increase again? $\text{//}$ 3) I disagree with the sklearn implementation of out-of-sample $R^2$, and I wonder if this is an instance of their metric having unexpected behavior (though I’m not convinced that it’s so weird). $\endgroup$
    – Dave
    Commented Aug 11, 2022 at 3:33
  • $\begingroup$ @Dave thank you. 1) No. 2) I was hoping you'll be able to shed more light on this (why?). 3) I get what you're implying (would you please elaborate more on why you don't think it's weird?) $\endgroup$
    – Z47
    Commented Aug 11, 2022 at 3:38
  • $\begingroup$ It willl be highly insightful to get a sense for why you think this should not happen. $\endgroup$
    – Dave
    Commented Aug 11, 2022 at 3:48

2 Answers 2

2
$\begingroup$

Tough to say for sure, but I anticipate the model may be overparameterized and hence have poor out of sample generalizability.

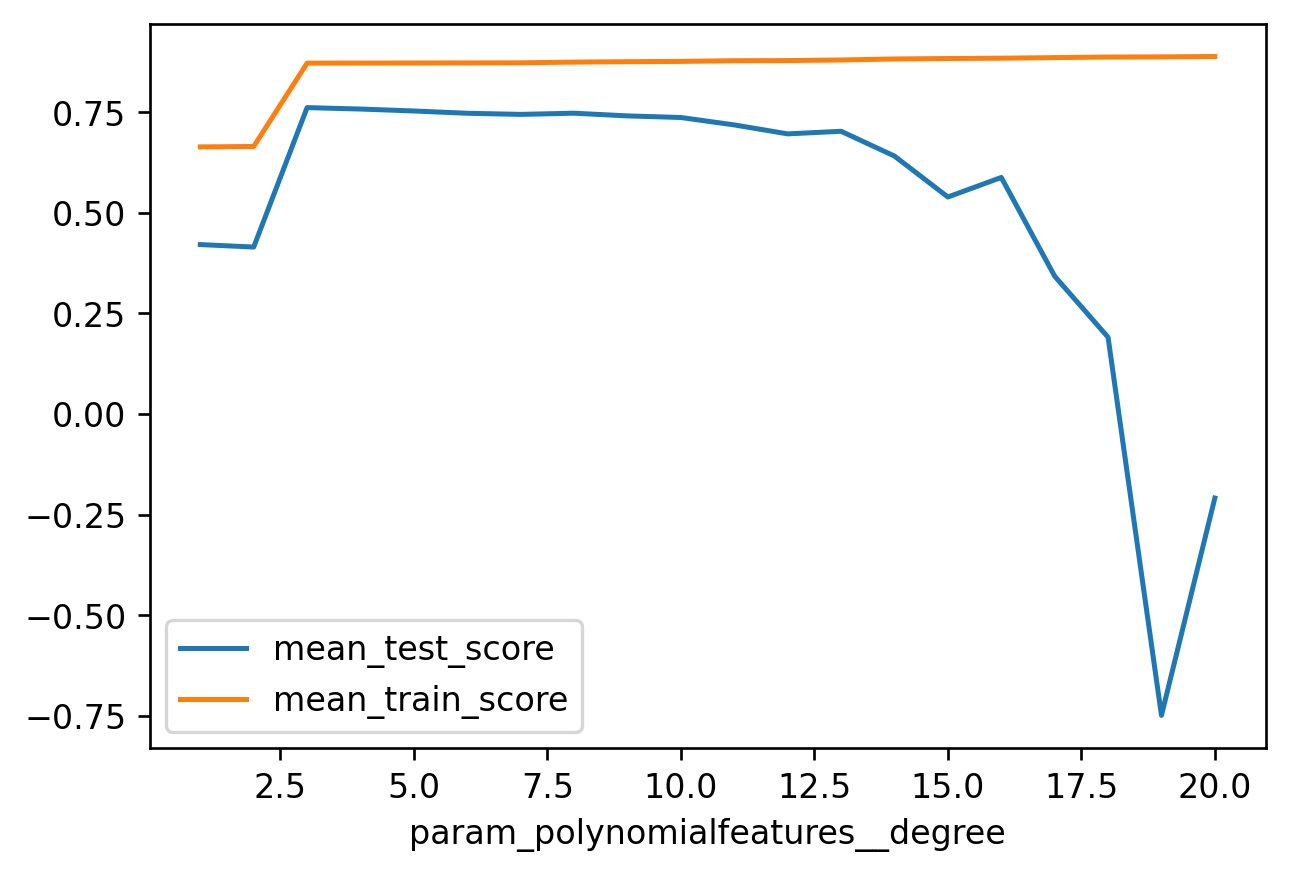
This is easy to see with a small example. Here, I've generated data from a degree 3 polynomial and cross validated over the degree for PolynomialFeatures. Here are the results of a 10 fold cross validation on rsquared

enter image description here

As you can see, as the degree increases sufficiently, the r squared declines much like in your example. This has to do with the bias variance trade off. As we add more parameters to the model (higher degree) the model becomes more variable as it loses bias (less biased in so far as it can now represent a broader class of functions). You're seeing the effects of this variability.

$\endgroup$
9
  • $\begingroup$ But why would it decrease and then increase again? My rationale is that we start out with high bias and low variance; then move to some bias and some variance; then move to slightly less bias but high high variance; and then move to miniscule bias and only slightly higher variance. Does this seem reasonable to you? $\endgroup$
    – Dave
    Commented Aug 11, 2022 at 4:57
  • $\begingroup$ Thank you for spending your time to answer this concern. It is much appreciated. So is there a way around this? or shall I just go with the polynomial that gives the highest R^2? $\endgroup$
    – Z47
    Commented Aug 11, 2022 at 4:58
  • $\begingroup$ maybe using decision trees (has low biased) will fit the data better then? $\endgroup$
    – Z47
    Commented Aug 11, 2022 at 5:08
  • $\begingroup$ @Dave We know about the relation between MSE and bias and variance. It is important to know that MSE appears in the expression of $R^2$. What happens to MSE as we take the model from high bias/low variance to low bias/high variance? How might that affect the $R^2$? $\endgroup$ Commented Aug 11, 2022 at 13:25
  • $\begingroup$ @Z47 Typically, when you do cross validation you pick the model which optimizes your metric. So yes, pick the degree with the largest cross validated R squared. Additionally, a decision tree is INCREDIBLY high variance so I anticipate things would get worse. $\endgroup$ Commented Aug 11, 2022 at 13:27
1
$\begingroup$

You don't provide a minimal reproducible example, so there is room for one more guess about the issue you report.

In a comment you say that you are working with 100 data points. So when you do 3-fold cross validation you end up training the model on 66, 67 and 67 points and evaluating it on another 34, 33 and 33 data points.

Obviously that's not much data to train a model on. The polynomial features make it even more challenging because polynomials are bad at extrapolating outside of the observed range.

So my stab at what's happening is that: (a) your data is small, so the in-fold range and the out-fold range of the predictor(s) end up being "different enough"; (b) you use polynomials which are bad at extrapolating outside of the range of the predictor(s) observed during training; and (c) you compound the problem with the intrinsic variability/instability of high-degree polynomials by using a different 3-fold split for each polynomial degree.

PS: There is another issue with how you do cross validation: You normalize the entire training data first, using all 100 points. However, the normalization step (I assume this is mean 0, variance 1 scaling?) is part of the modeling pipeline, so it should be cross validated as well.

$\endgroup$
1
  • $\begingroup$ Thanks a bunch, I thought about reasons (a) and (c), reason (b) though, never came to my mind. Thank you for providing such an informative answer! $\endgroup$
    – Z47
    Commented Aug 11, 2022 at 22:13

Your Answer

By clicking “Post Your Answer”, you agree to our terms of service and acknowledge you have read our privacy policy.

Not the answer you're looking for? Browse other questions tagged or ask your own question.