I'm using a Cox proportional hazards model to look at the relationship between coyote survival and various environmental factors.
The model summary indicates that the proportion of natural habitat has a negative effect on the hazard ratio/positive effect on survival:
coxph(formula = Surv(survTime, status) ~ propWST + medIncST +
    popDensST + agST + natST + distST + Sex, data = dataPup)

  n= 46, number of events= 8

              coef exp(coef) se(coef)      z Pr(>|z|)
propWST   -0.66960   0.51191  0.62104 -1.078  0.28095
medIncST  -0.04653   0.95453  0.67510 -0.069  0.94505
popDensST -1.24134   0.28900  0.84896 -1.462  0.14369
agST       1.03962   2.82815  0.97058  1.071  0.28411
natST     -5.17965   0.00563  2.00708 -2.581  0.00986 **
distST    -2.92358   0.05374  1.61610 -1.809  0.07045 .
Sexm       0.62473   1.86775  1.02063  0.612  0.54047
---
Signif. codes:  0 ‘***’ 0.001 ‘**’ 0.01 ‘*’ 0.05 ‘.’ 0.1 ‘ ’ 1

          exp(coef) exp(-coef) lower .95 upper .95
propWST     0.51191     1.9535 0.1515552    1.7291
medIncST    0.95453     1.0476 0.2541827    3.5846
popDensST   0.28900     3.4602 0.0547339    1.5259
agST        2.82815     0.3536 0.4220287   18.9523
natST       0.00563   177.6207 0.0001102    0.2877
distST      0.05374    18.6077 0.0022630    1.2762
Sexm        1.86775     0.5354 0.2526722   13.8063

Concordance= 0.912  (se = 0.047 )
Likelihood ratio test= 23.87  on 7 df,   p=0.001
Wald test            = 10.11  on 7 df,   p=0.2
Score (logrank) test = 25.2  on 7 df,   p=7e-04
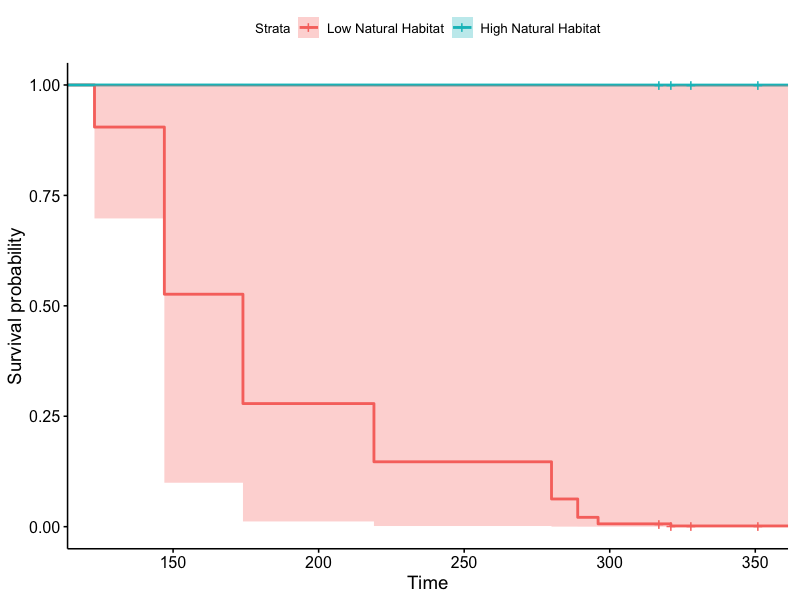
Next I use ggsurv to plot the survival curves at low (0.2) and high (0.8) proportions of natural habitat and I get the following plot:
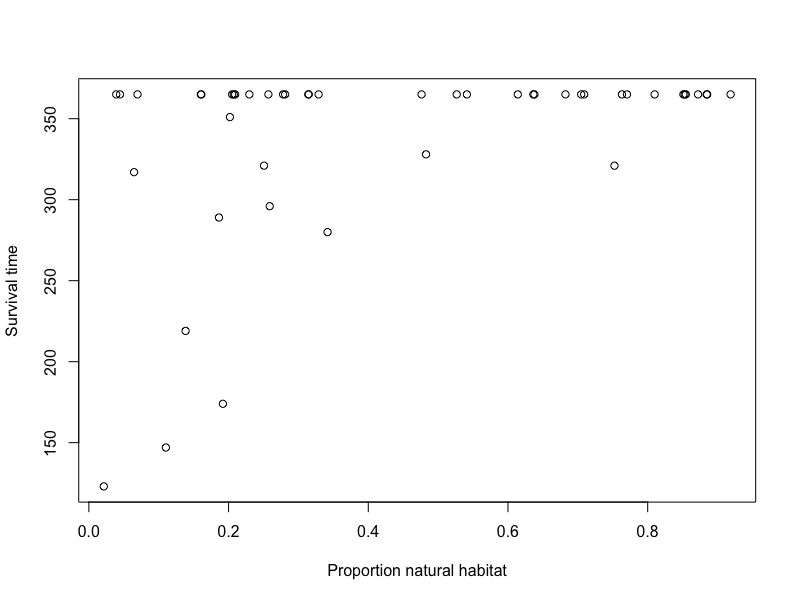
As you can see the CI for high natural habitat is incredibly small and the CI for low habitat incredibly large. Additionally, survival for the low habitat animals is 0 by the end of the first year (365 days) which doesn't reflect the raw data as you can see in this scatter plot:
The only answer I could find that is somewhat related to my questions is this. Based on this answer I'm wondering if my predicted plot is inaccurate and if I should instead do the analysis in rms. Thanks.


rmspackage, recommends estimating no more than 1 coefficient value per every 15 events in a survival dataset. See Section 4.4 of his course notes, for example. With only 8 events you shouldn't be trying to estimate 7 coefficient values unless you are using a heavily penalized model (e.g., ridge regression or LASSO). Although I have found an error in another plot function in thesurvminerpackage, I see no reason to doubt the plot you show. If you will be doing much regression modeling, do learn thermspackage. $\endgroup$