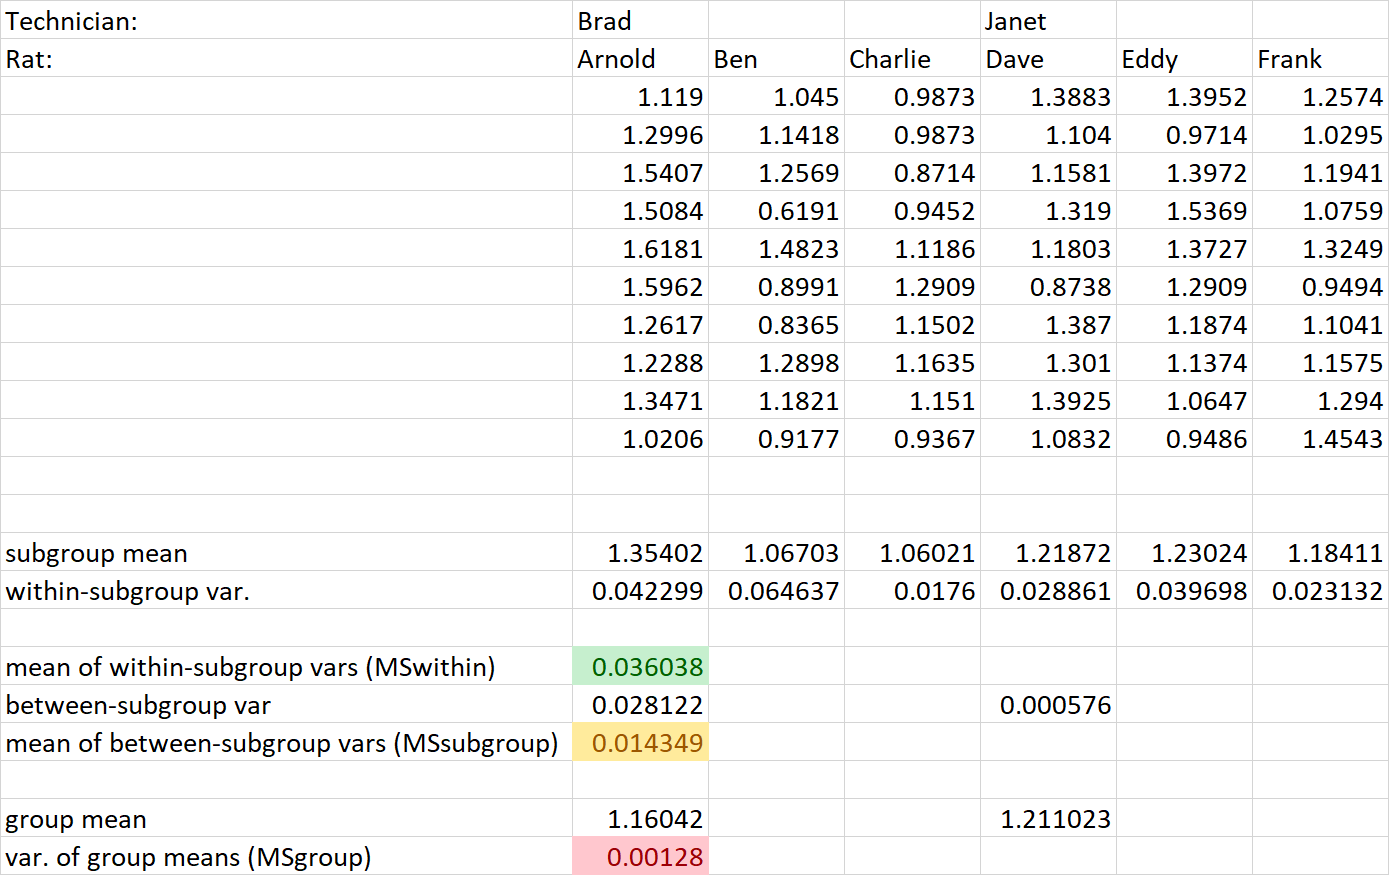
I'm working on the example for nested ANOVA from the Handbook of Biological Statistics. Copy-pasteable data can be found at https://www.biostathandbook.com/nestedanova.html and below shows my calculation.
According to the text, MSwithin, MSsubgroup and MSgroup are 0.0360, 0.1435 and 0.0384, respectively. I got only MSwithin exactly the same (green), my MSsubgroup is 1/10 smaller (yellow), and my MSgroup is completely off (red).
The definition:
- subgroup mean and within-subgroup var are simply column mean and column variance for each rat;
- mean of within-subgroup vars is the mean of within-subgroup vars;
- between-subgroup var is the variance of subgroup means for each technician;
- mean of between-subgroup vars is the mean of between-subgroup vars;
- group mean is the mean of the 30 data points for each technician;
- var. of group means is the variance of group means.
Can anybody let me know where I did miscalculation or something is wrong in the text? Thanks.
Update1: The text must be correct as the results can be recapitulated as follows:
X = read.table(textConnection(
"
Tech  Rat Protein
Janet 1   1.119
Janet 1   1.2996
Janet 1   1.5407
Janet 1   1.5084
Janet 1   1.6181
Janet 1   1.5962
Janet 1   1.2617
Janet 1   1.2288
Janet 1   1.3471
Janet 1   1.0206
Janet 2   1.045
Janet 2   1.1418
Janet 2   1.2569
Janet 2   0.6191
Janet 2   1.4823
Janet 2   0.8991
Janet 2   0.8365
Janet 2   1.2898
Janet 2   1.1821
Janet 2   0.9177
Janet 3   0.9873
Janet 3   0.9873
Janet 3   0.8714
Janet 3   0.9452
Janet 3   1.1186
Janet 3   1.2909
Janet 3   1.1502
Janet 3   1.1635
Janet 3   1.151
Janet 3   0.9367
Brad  5   1.3883
Brad  5   1.104
Brad  5   1.1581
Brad  5   1.319
Brad  5   1.1803
Brad  5   0.8738
Brad  5   1.387
Brad  5   1.301
Brad  5   1.3925
Brad  5   1.0832
Brad  6   1.3952
Brad  6   0.9714
Brad  6   1.3972
Brad  6   1.5369
Brad  6   1.3727
Brad  6   1.2909
Brad  6   1.1874
Brad  6   1.1374
Brad  6   1.0647
Brad  6   0.9486
Brad  7   1.2574
Brad  7   1.0295
Brad  7   1.1941
Brad  7   1.0759
Brad  7   1.3249
Brad  7   0.9494
Brad  7   1.1041
Brad  7   1.1575
Brad  7   1.294
Brad  7   1.4543
"
),header=TRUE)

X$Rat = as.factor(X$Rat)
summary(aov(Protein ~ Tech + Error(Rat), data = X))

## Error: Rat
##           Df Sum Sq Mean Sq F value Pr(>F)
## Tech       1 0.0384 0.03841   0.268  0.632
## Residuals  4 0.5740 0.14349

## Error: Within
##           Df Sum Sq Mean Sq F value Pr(>F)
## Residuals 54  1.946 0.03604
Update2: It turns out that I mistook the between-subgroup variance for the between-subgroup mean of squares. The latter should be exactly 10 times the former because of the sample size 10 for each subgroup.
Update3: Same reason applies to MSgroup. Since each group has 30 observations, vars. of group means times 30 is 0.03841046, the same as the text value.

