FactoMineR package is helpful when doing PCA and much more. Coming across the output using dimdesc() function and looking at the estimates of supplementary qualitative variables I didn't grasp the idea of how these estimates were calculated. After peeking into the code of the function, these estimates seem to be those of ANOVA test.
FactoMineR dimdesc()
FactoMineR::dimdesc
FactoMineR::condes
I found the relevant code in condes() function which was called from inside dimdesc() function.
...
res.aov <- aov(y ~ x, weights = w, na.action = na.exclude)
...
truncated
...
Estimate <- summary.lm(res.aov)$coef[-1, 1, drop = FALSE]
Estimate <- c(Estimate, -sum(Estimate))
...
truncated
MWE: Decathlon dataset
library(FactoMineR)
data(decathlon)
res.pca <- PCA(decathlon,quanti.sup=11:12,quali.sup=13)
Output of PCA by dimdesc() function
dimdesc(res.pca, proba = 0.2)
The estimates according to FactoMineR
Link between the variable and the categorical variable (1-way anova)
=============================================
                R2 p.value
Competition 0.0511  0.1553

Link between variable abd the categories of the categorical variables
================================================================
                     Estimate p.value
Competition=OlympicG   0.4394  0.1553
Competition=Decastar  -0.4394  0.1553
So as you can see, the qualitative variable (Competition) was a supplementary one, it doesn't contribute to constructing the very principal components of the PCA, they are just fed for descriptive and illustrative purposes.
My trial to verify the estimates manually
decathlon$PC1 <- res.pca$ind$coord[, 1] # attaching PC1 or Dim1 to the dataset
We use ANOVA test now:
resAOV <- aov(PC1 ~ Competition, data = decathlon, na.action = na.exclude)
summary.lm(resAOV)
Output:
> summary.lm(resAOV)

    Call:
aov(formula = PC1 ~ Competition, data = decathlon, na.action = na.exclude)

Residuals:
   Min     1Q Median     3Q    Max
-3.379 -0.961 -0.009  0.957  4.341

Coefficients:
                    Estimate Std. Error t value Pr(>|t|)
(Intercept)           -0.600      0.501   -1.20     0.24
CompetitionOlympicG    0.879      0.606    1.45     0.16

Residual standard error: 1.81 on 39 degrees of freedom
Multiple R-squared:  0.0511,    Adjusted R-squared:  0.0268
F-statistic:  2.1 on 1 and 39 DF,  p-value: 0.155
As you can see the p-value agrees with the dimdesc() output (0.155), however the estimate for OlympicG is (0.879) which is two times more than what dimdesc() function reported, why is that? Is there a statistical explanation to this or is it a bug in the function?
Below is an excerpt from the book about FactoMineR using the same dataset on these estimates with some explanation:
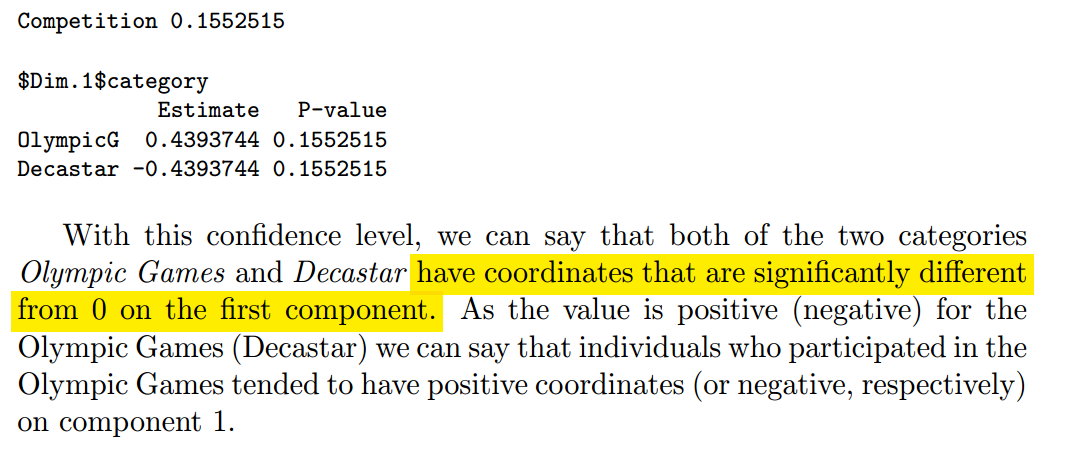
Book excerpt on FactoMineR
On page 40 of "Exploratory Multivariate Analysis by Example Using R" by François Husson, we read the following:
Note
FactoMineR version:2.6
R version 4.2.1 (2022-06-23) -- "Funny-Looking Kid"

