I've been working on a project recently to take the input values to a physics simulation that takes a long time to run, and to represent the simulation in a neural network predicting certain key output variables.
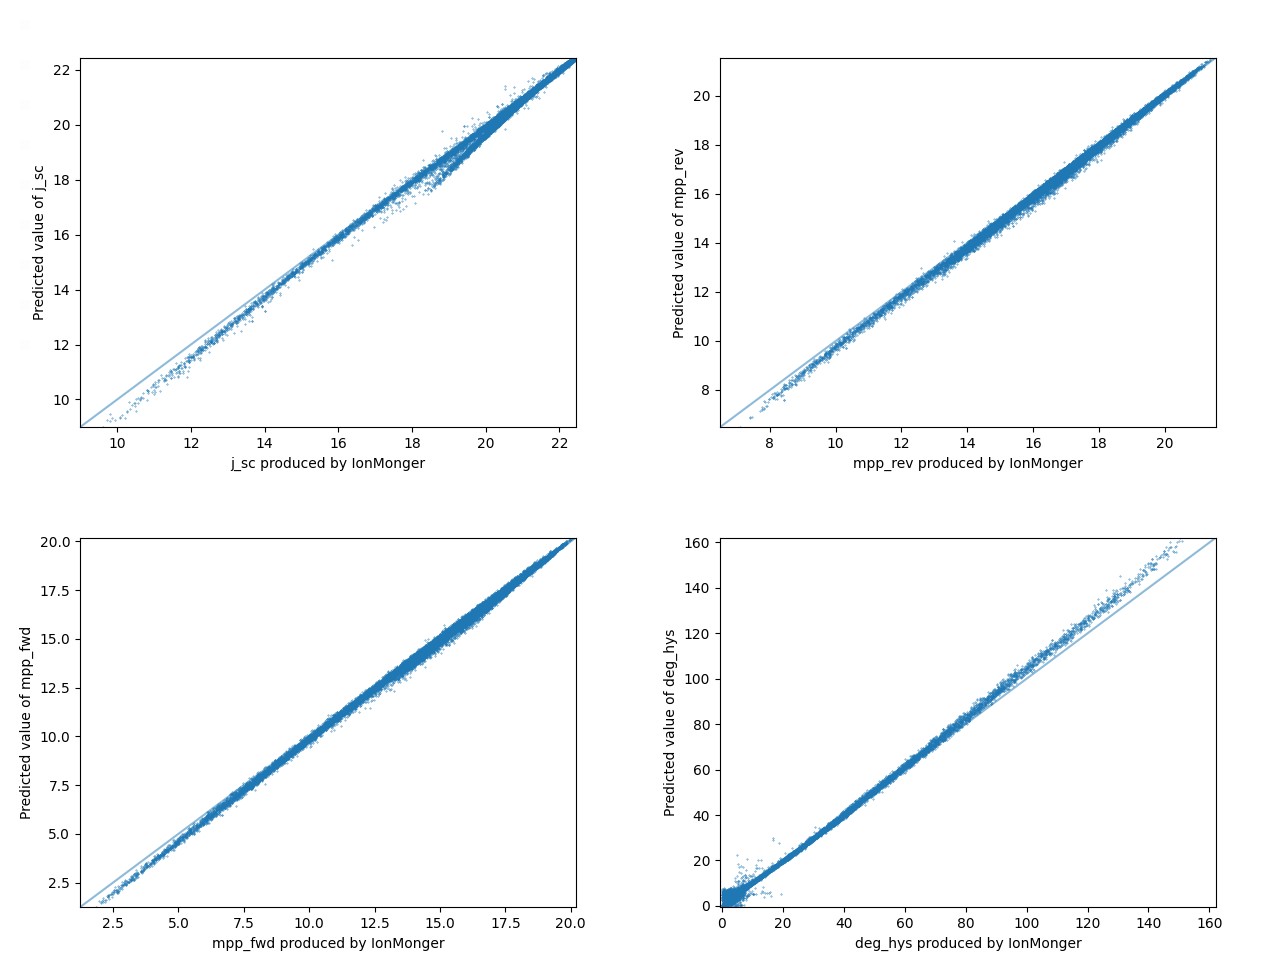
There is a considerable amount of training data (270,000 data points for a 9-dimensional input). However as you can see below, the trained model seems to consistently predict values in the wrong region of space.
The figure above shows the comparison of predictions (y-axis) of four of the 6 output variables with the values produced by the physics simulation (x-axis). A perfect model would exactly match the y=x function that is overlaid underneath in a lighter blue.
My query is regarding these regions of parameter space where the predictions seem to deviate somewhat uniformly, for example, the "Hook" section of the top left graph between about 19 and 21. Another interesting region is the roughly 500 training points (only including values not roughly on the y=x line) that make up the odd blob between 0 and 8 in the bottom right-hand graph.
I would imagine that this is an issue with my loss function so I will include the code below with a rationalization of the choices made regarding model design.
# <1>

x_train, x_test, y_train, y_test = data_loader()

# <2>

model = Sequential()
model.add(Dense(500, activation='gelu', input_shape=(9,)))
model.add(BatchNormalization())
model.add(Dropout(0.1))
model.add(Dense(250, activation='gelu'))
model.add(BatchNormalization())
model.add(Dropout(0.1))
model.add(Dense(125, activation='gelu'))
model.add(BatchNormalization())
model.add(Dropout(0.1))
model.add(Dense(6, activation=None))
model.summary()

# <3>

model.compile(loss='mean_absolute_percentage_error', optimizer='Adam', metrics=['accuracy'])

# <4>

model.fit(x_train, y_train, batch_size=10000, epochs=20)

score = model.evaluate(x_test, y_test)
print('Test loss:', score[0])
print('Test accuracy:', score[1])

# <5>

model.save('save_files/map_adam')
<1>: Data processing. The input data is all normalized either linearly between 0 and 1 or logarithmically, whereas the output data is left as is, I have thought about trying to fit the data to a normal distribution of mean=var=1 and to use that as an output but I don't know how to do this so if it is not worth the effort then I might leave the model as is. Unfortunately, the data is also not necessarily distributed normally, for example, some of the data, within a range resembles a negative exponential curve.
<2>: Model. I reckon that this model is probably big enough, and dropout and batch normalization layers were implemented to try and minimize overfitting and hopefully speed up training respectively.
<3>: Loss and Optimiser choice. Currently using absolute percentage error as this works far better for the ranges of outputs that are being used here (one output ranges from 0.95 to 1.05 and another from 0.05 to 160). Adam was chosen as I'm familiar with adagrad/adadelta and as far as I'm aware Adam is a straight upgrade to those methods.
<4>: Batch size and number of epochs. Batch size of 10000 was chosen as I thought this would likely be large enough to represent the space while maintaining a reasonable amount of time to train. Around 1500 epochs have now gone into training and have produced a test loss of around 2 that I can't seem to improve on, however, as you can see from the figure above, there are definitely areas of improvement.
If you have any feedback, suggestions, or obvious mistakes that you can see I have made, then I would love to hear them.
Thank you in advance. :)

