I want to predict the future data given the time series data with SARIMA model.
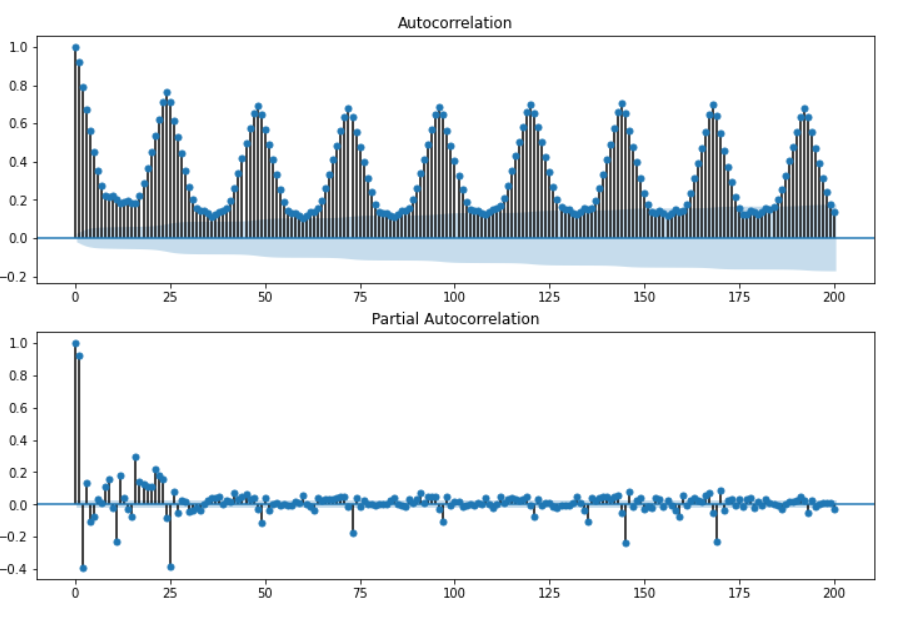
In order to determine (p, d, q) and (P, D, Q, m), I plotted the ACF and PACF.
The ACF graph shows that there is a seasonality of 24 intervals, so I set the m as 24.
However, I don't know how to set, p, d, q, and P, D, Q.
In other example, ACF graph usually degrades exponentialy, so they set p and q as 1 or 2.
But my ACF graph has cycles, so I am confused about how to set p and q.
Could you help me?

