I'm quite new with linear mixed-effects models. Could you tell me some general rules to choose which effect is fixed and which effect is random in my regression model? Also, how do you decide when to add random slopes in addition to a random intercept? Is the choice mainly driven by model comparisons based on BIC (for instance)?
1 Answer
You have a number of questions, so I will answer them in each section below.
Could you tell me some general rules to choose which effect is fixed and which effect is random in my regression model?
This subject is sometimes a complex one and it may be wise to go through this FAQ on GLMMs to understand why. However, I think of fixed effects as the following:
- It is of theoretical interest (in other words you expect it to be a primary driver of your outcome). A classic example is father heights regressed on son heights, which we would expect to be directly correlated.
- Contrarily, a random effect is considered "random noise"...you are more interested in what fluctuations in outcomes may arise based on its inclusion rather than its sum effect on the outcome. As an example, if the same son/father heights were obtained from several cities across Germany, we may want to know the average variation by city in SD, but knowing 200 or so city estimates would likely be less useful.
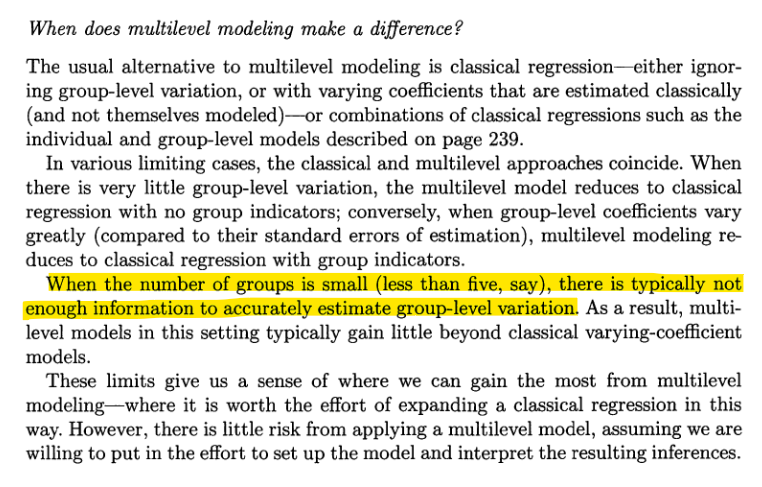
- A random effect generally has 5 or more levels (i.e. if you include hospitals in a cancer study as random effects, there should be more than 5 hospitals used) (Gelman & Hall, 2007, p.247).
- Fixed effects can also be random effects. It depends on the modeling decisions made.
As quoted in an article linked below, "Absolute rules for how to classify something as a fixed or random effect generally are not useful because that decision can change depending on the goals of the analysis" (Harrison et al., 2018, p.3-4). However, what I have listed so far may at least help guide your decision.
How to decide to add random slopes in addition to a random intercept?
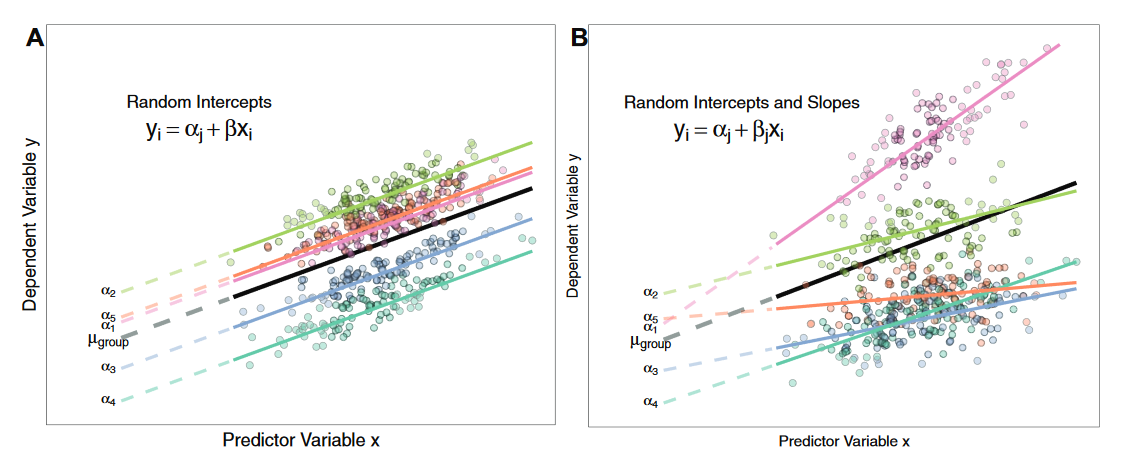
First, I provide a visualization from Harrison, et al., 2018 which helps show what random intercepts look like (left) and random intercepts with slopes included (right). It may help to refer back to this visual as I explain below.
I will use a Gaussian (normally distributed) mixed model as an example to simplify a bit. A fixed intercept (the one you obtain in most regressions, shown as $\mu_{group}$ in the visual) can be considered a conditional mean of your outcome, and your predictors are factors that change this mean. A random intercept is an "adjustment" to this conditional mean (shown as $a_1$ to $a_5$ in the visual).
To illustrate this, we can use income in USD as an outcome for a regression as an example. Lets say the fixed intercept for this regression is 30,000 USD, which means that after accounting for all other factors in our model, the average baseline salary is 30,000 USD. We also model in the random effect of the city where somebody lives because we believe socioeconomic status (SES) may impact this. So City A's random intercept is +2,000 whereas City B's random intercept is -3,000. This means on average, after controlling all other factors in the regression, City A residents will average 32,000 USD for income while City B residents will average around 29,000 USD. With this information, we know that the average income is a set amount (30,000), but we also know the increases/decreases based on city (+2,000/-3,000). In the visualization to the left, you can picture each colored line as a different city's random intercept ($a_2$ has the highest intercept value, while $a_4$ as the lowest).
A random slope is included if we don't believe this random effect change is constant (in other words we think some other variable may alter how strong this relationship is or even which direction it goes). For our income example, we may believe that a city resident's rated assertiveness may affect income. As assertiveness may drive residents to ask for more raises and engage in more ambitious projects, this may get them more raises at work. So we include it as a fixed effect (it is theoretically important to income increases), but we also think this may vary in each city (perhaps we believe this fluctuates based on SES of each city) and influence change in each city's adjusted intercept. Thus we may include it as a random slope as well.
If we applied this logic to the visualization above, we could picture $a_1$ (the pink line) as the matches between assertiveness ratings of each resident (x) and their respective income (y) for that specific city. The effect is fairly strong and positive for this city. However you can see the other cities may vary a lot based on this same relationship. By adding a slope term, we can adjust the fixed intercept (30,000 USD) and the random intercept (i.e. +2,000 USD) by an assertiveness term (each unit increase in assertiveness adds, say, 500 USD to the 32,000 USD calculated average for this city).
Is the choice mainly driven by model comparisons based on BIC (for instance)?
This is also a bit of a hairy subject, but Pages 20 to 25 of Harrison, et al., 2018 give a nice summary. Model selection is performed in the following ways:
- LRT tests
- Stepwise selection
- AIC/BIC
How you employ these is dependent on the modeling used, and I would suggest reading their article to get more information on when and where to apply these. However, I would strongly suggest that you create a model that is both theory-driven and data-driven. Blind model comparison can be a bit unscientific, especially if you create a handful of candidate models and test your way into one that is the "best" version.
-
1$\begingroup$ You're answer is amazing. Thanks for your huge help and contribution, I'm sure that such answers will be useful for the whole community. As a rule of thumb, let's wait a few hours to encourage others to reply, I'll come back to click the best answer. $\endgroup$ Commented Dec 31, 2022 at 9:13
-
$\begingroup$ No worries. Glad you found it helpful :) $\endgroup$ Commented Dec 31, 2022 at 9:13


