2
$\begingroup$

I've been reading about how object detection models are evaluated. It seems that the metric most often used is AP. But I have stumbled upon 2 different approaches that I think mean completely different things:

In the first approach, we use different IOU thresholds for defining what constitutes a TP and FP (wrt to bounding boxes) and compute a pair of points (precision, recall) for every threshold (by going through every detection). We compute the area under the curve and we have the Average Precision of the model, for a given class.

The second approach is stranger: we have a fixed threshold say 0.5 and go through every detection for a class, if the IOU of that detection > 0.5 then is this TP, otherwise is a FP. For every detection, we compute the precision based only on the predictions made up until a detection and the recall using information of the total number of elements of particular class in the dataset. In this scenario, we have as many (precision, recall) points as we have detections, and as we move forward in the detections the recall gets closer to 1, and the precision zizags. In this version of AP we compute the area under the curve of this graph. They call this AP_0.5, you can also compute others by changing the threshold.

I've trouble reconciling the 2 methods, the first one makes sense to me as a way of evaluating a model, but the second one, not so much. What does AP_0.5 tell us, why not just computing precision and recall for the threshold of 0.5 (using all detections) and compute an F1 score for each class?

Thank you for the help in advance!!

$\endgroup$

1 Answer 1

2
+100
$\begingroup$

I think these two approaches give you two different informations, while the first may be contained in the second.

These two approaches allow you to calculate two different curves, because there are two hyperparameters involved:

  • Confidence threshold: the threshold of the confidence, How much the model estimates the probability that there is an object inside the bounding box
  • IoU threshold: threshold of IoU, ratio of the area between the true bounding box and the predicted bounding box

I find the second procedure you listed is the way to go,it describes first the PR curve, and the mean of the integrals of the per-class PR curves yields the mAP.

The first procedure describes a AP-IoU curve, but I did not find an extensive description of it. I feel it could be calculated simply by calculating the mAP for different threshold values, or by only calculating precision and recall with a fixed confidence.

Precision-Recall curve

  1. Compute the detections for the whole evaluation set at a fixed IoU value, and rank them by descending Confidence.

  2. For each class, do the following

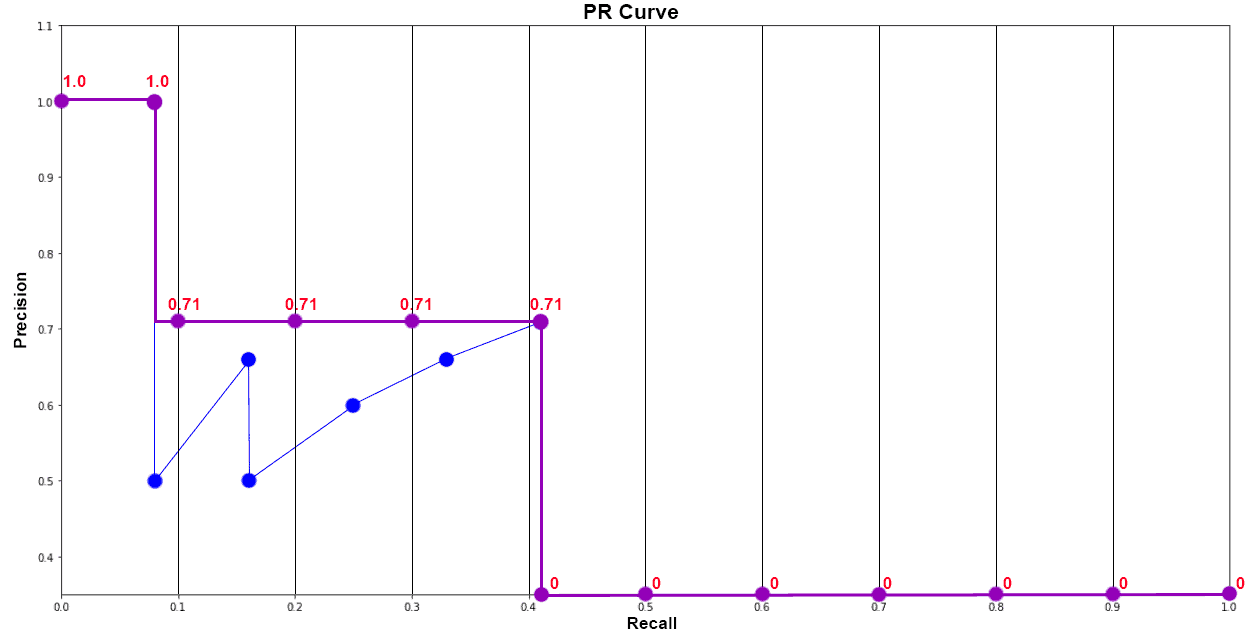
    1. Calculate the Precision and Recall reached with each detection: If it is a TP the recall will increment, while if it is a FP the precision will decrement. The recall is nondecreasing, while the precision can go up and down, giving you the sawtooth curve you mentioned (blue line).

      An alternative is to perform an interpolation of the sawtooth curve with 11 different recall values (you pick the maximum precision corresponding to a recall value greater than the current, obtaining a step curve, purple line)

    2. Calculate the Average Precision (AP) as integral of the area under the Precision-Recall curve.

    3. Calculate the mean of the Average Precisions: this is useful since the object detector could have worse performances on certain under-represented classes.

PR Curve

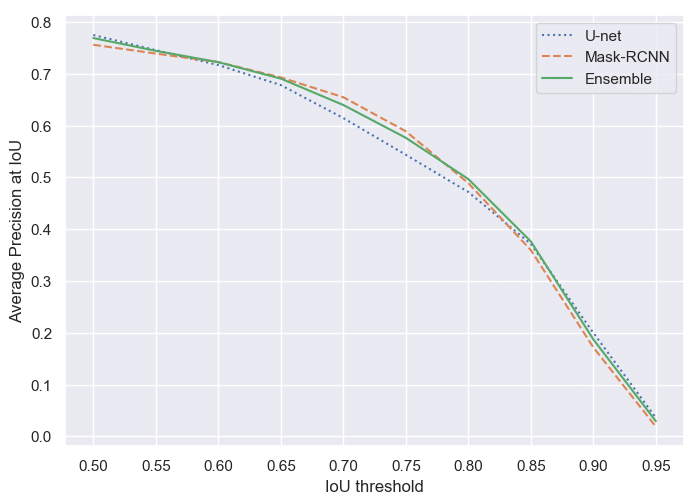
AP-IoU threshold curves

  1. Set a number of IoU values you want to calculate (ex. from 0 to 1 with 0.1 increments)

  2. For each IoU, calculate the mAP using the method described before, or a general AP for all classes (It is different, since the first method penalizes more a poor performance on few, under-represented classes)

IoU-AP curve

For every detection, we compute the precision based only on the predictions made up until a detection and the recall using information of the total number of elements of particular class in the dataset

An important part is that the detections are ranked by descending confidence level of the detection. This is a hyperparameter to set in your model.

By simply calculating the F1 score with precision and recall of each class you have no indication of how the precision changes with the recall, e.g. if the precision drops after a critical confidence value.

A good summary of the procedure is present in this repo and this blog

$\endgroup$
5
  • $\begingroup$ Thank you for your answer. So the relevance of this metric is that it shows precision across the confidence level of the various detections. I think this is what I was missing. The first approach, where you change the threshold won't reflect the effects of predictions confidence. My question would be then why use one or the other? $\endgroup$ Commented Jan 18, 2023 at 13:50
  • $\begingroup$ Could you provide the source where you read about these two approaches? It is not clear in the first approach if you intend to keep the IOU threshold fixed for each computation of precision and recall of the detections (which seems logic to me) or not. $\endgroup$
    – Ciodar
    Commented Jan 18, 2023 at 14:02
  • $\begingroup$ Yes, you would keep IOU threshold fixed and compute the precision and recall for the entire evaluation set. You would have as many pairs (precision, recall) as thresholds. That would give you a graph at which you can integrate to get average precision. (cocodataset.org/#detection-eval). At least is what I understand from their description. But it could be that they do the procedure you just described for every threshold and then just average everything at the end. $\endgroup$ Commented Jan 18, 2023 at 15:16
  • $\begingroup$ If in fact they do the last thing I mentioned why not just compute a pair of precision-recall points per threshold, and integrate for AP? Instead of computing lots of precision recall points per threshold, doing AP of that and taking an average (of the AP's for every threshold) at the end ? $\endgroup$ Commented Jan 18, 2023 at 15:22
  • $\begingroup$ I've edited the answer. I think that the two approaches describe two different curves. The first one is sometimes called IoU- AP curve, while the second is the more common PR curve, whose integral yields the AP, and the mean of the per-class AP gives you the mAP. $\endgroup$
    – Ciodar
    Commented Jan 18, 2023 at 18:51

Your Answer

By clicking “Post Your Answer”, you agree to our terms of service and acknowledge you have read our privacy policy.

Not the answer you're looking for? Browse other questions tagged or ask your own question.