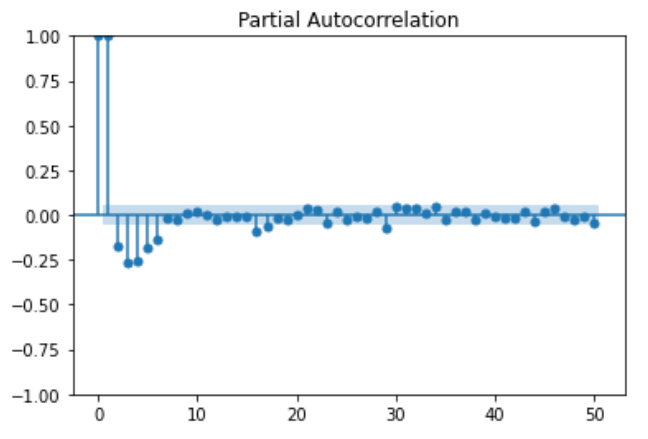
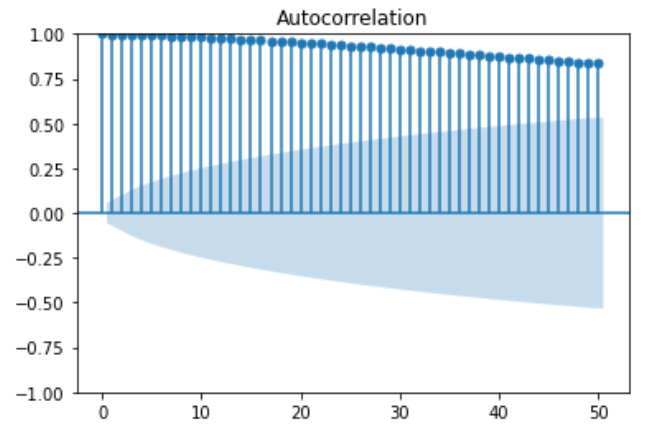
I have time series data which is measured in each 5 second. I am trying to forecast the data. But, ACF and PACF results are seems to different than other plot that I have seen. I am using statsmodels as a library like below.
from statsmodels.graphics.tsaplots import plot_pacf
plot_pacf(ts, lags = 40, method = "ols");

from statsmodels.graphics.tsaplots import plot_acf
plot_acf(ts, lags = 50);
What I need to interpret with these plots?


